1. Home > 
  2. Stock Photos > 
  3. Abstract Financial Charts with Colorful Holographic Effects

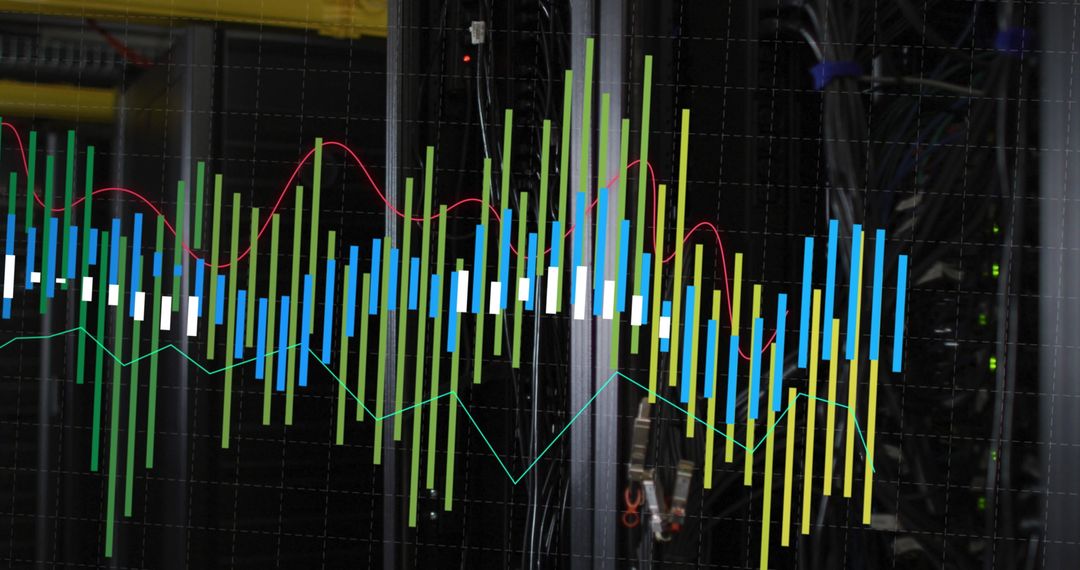
Abstract Financial Charts with Colorful Holographic Effects Image

Abstract Financial Charts with Colorful Holographic Effects

This visually striking image showcases multiple colorful graphs and charts set against a dark purple abstract background, enhanced with lens flare effects. Ideal for uses in financial presentations, technology-focused projects, data analytics reports, and business marketing materials to convey innovation and digital trends.

Powered by Shutterstock logo - Get 15% off with code: PIKWIZARD15
Business man holding tablet and showing holographic graphs and stock market statistics gain profits. Concept of growth planning and business strategy. Display of good economy form digital screen. - Powered by Shutterstock - Get 15% off with code: PIKWIZARD15Businessman holding tablet and showing holographic graphs and stock market statistics gain profits. Concept of growth planning and business strategy. - Powered by Shutterstock - Get 15% off with code: PIKWIZARD15City skyline with a holographic overlay of financial data, graphs, and charts. Clear sky background. Concept of technology and finance innovation - Powered by Shutterstock - Get 15% off with code: PIKWIZARD15Businessman analyzing virtual data futuristic holographic dashboard business intelligence BI financial analysis big data visualization. stock market investment trends financial performance statistics - Powered by Shutterstock - Get 15% off with code: PIKWIZARD15Businessman analyzing virtual data futuristic holographic dashboard business intelligence BI financial analysis big data visualization. stock market investment trends financial performance statistics - Powered by Shutterstock - Get 15% off with code: PIKWIZARD15

Credit Photo

If you would like to credit the Photo, here are some ways you can do so

Free (free of charge)

Free for personal and commercial use.

Author: Awesome Content

Similar Free Stock Images

Digital Financial Data Analysis with Chart and Markers
Premium
Businessman analyzing virtual data futuristic holographic dashboard business intelligence BI financial analysis big data visualization. stock market investment trends financial performance statistics
Dynamic Financial Data Analytics Interface with Blue Background
Financial Data Processing Visualization with Colorful Bar Charts
Digital Financial Data Over Urban Night Skyline
Abstract Digital Financial Chart on Blue Interface
Premium
Businessman analyzing virtual data futuristic holographic dashboard business intelligence BI financial analysis big data visualization. stock market investment trends financial performance statistics
Digital Data Graphs with Blue Background and Light Flare
Abstract Digital Chart on Black Background Representing Data Analysis
Data Processing Visualization with Cityscape Background
Futuristic Data Analytics with Graphs and Charts
Premium
Presenting dashboard overlaying skyline silhouette, with bars, line graph, dotted world map, labels. Analytics, data visualization, financial, technology, insight, digital, business
Data Analytics Graphs on Blue Digital Background
Dynamic Bars Overlapping Graph in Financial Analysis
Futuristic Data Analytics Over Digital Interface Background
Abstract Financial Data Chart Over Urban Skyline
Premium
Finance and investment concept. Businessman hand holding holographic bar chart with percentage sign on dark background with copyspace idea for Financial growth, investment return,Business growth.
Digital Financial Data Visualization with Bar Graphs and Line Charts
Data Visualization Overlay in Dark Computer Server
Colorful Financial Graph with Digital Technology Concept
Colorful Financial Data Analytics and Digital Graph
Premium
Person typing on a laptop, surrounded by holographic charts, graphs, and data elements. Futuristic tech background. Concept of fintech and innovation
Dynamic Financing Data Visualization on Hungary Flag
Financial Data Processing in Digital Interface Concept
Digital Data Processing Chart and Interface on Pink Background
Financial Data Processing with Molecular Overlay in a Digital Interface
Premium
Credit card on laptop keyboard with holographic forex chart, world map overlay, and trading data in abstract digital fintech economy concept
Digital Analytics Dashboard with Code and Graphs Visualization
Dynamic Financial Market Chart Display with Candlesticks
Colorful Soundwave Over Urban Skyline Abstraction
Colorful Candlestick Chart on Trading Interface
Global Financial Data Interaction and Digital Analytics
Digital Stock Market Pulse with Numbers on Blue Background
Premium
Businessman analyzing virtual data futuristic holographic dashboard business intelligence BI financial analysis big data visualization. stock market investment trends financial performance statistics
Vibrant Financial Data Analysis on Black Background
Digital Data Processing Over Modern Glass Building
Futuristic Digital Data Analysis Visual with Line Graphs
Dynamic Data Visualization on Digital Interface
Premium
Businessman analyzing virtual data futuristic holographic dashboard business intelligence BI financial analysis big data visualization. stock market investment trends financial performance statistics
Colorful Data Streams in Digital Interface
Dynamic Financial Graph with Green and Red Candles
Financial Data Analytics in Digital Interface Design
Vibrant Digital Stock Market Graph Showing Financial Data Trends
Premium
Neon pink circle showing rising line in financial dashboard, with candlestick bars and green mesh. Futuristic, digital, holographic, data visualization, technology, analytics, investment
Financial Data Visualization with Line and Bar Graphs
Dynamic Colorful Wave Pattern on Dark Background
Visualizing Financial Data Trends Over Urban Backdrop
Colorful Financial Data Visualization on Digital Grid
Premium
Presenting world map silhouette pulsing with vivid candlestick charts on grid, with financial data. Abstract, visualization, analytics, digital, futuristic, data, technology
Colorful Graphical Data Analysis in Abstract Background
Dynamic Financial Data Chart on Blue Background
Statistical Analysis in Server Room Highlighting Technology Data
Futuristic DNA Windows Background with Gradient and Abstract Signal Waves
Premium
Displaying concentric holographic rings over water, with data panels, line charts and grid overlay. Futuristic, technology, finance, visualization, marine, digital, innovation
Financial Data Analysis with Graphs and Charts on Dark Background
Data Visualization with Diagrams on Green Gradient
Dynamic Stock Market Graph with Fluctuating Data Bars
Financial Data Display with Candlesticks and Trend Lines on Digital Dashboard
Premium
Holographic financial graphs and data over glasses and keyboard on blurry background, representing business, fintech, and market analysis
Colorful Digital Waveform Display with Vertical Bars
Dynamic HTML Code and Waveform Bar Interface for Cybersecurity
Vibrant Financial Candlestick Chart with Trend Lines
Digital Data Visualization in Global Business Context
Abstract Financial Data Technology Background
Financial Data Charts in Blue Digital Interface Background
Premium
Businessman analyzing virtual data futuristic holographic dashboard business intelligence BI financial analysis big data visualization. stock market investment trends financial performance statistics
Abstract Digital Data Flow on Modern Building Facade
Abstract Financial Data Visualization on Tech Background
Abstract Colorful Bar Graph on Red Background
Digital Graph with Abstract Data on Blue Background
Premium
A person's hand presents a futuristic holographic chart showing financial growth predictions for 2026. Data includes bar graphs, trend lines, and fluctuating numbers on a dark background.
Financial Candlestick Chart on Digital Grid Background
Digital Financial Analytics with Zero Percent Concept
Dynamic Financial Chart with Blue and Purple Indicators
Financial Data Charts and Graphs on Digital Interface
Premium
Businessman using laptop analyzing stock trading, investor, holographic candlestick chart showing financial data, investment trends and foreign exchange rates for business and economic growth.
Digital Financial Graph and City Silhouette Backdrop
Global Business Dashboard Overlay on Urban Skyline Background
Digital Analysis of Financial Data with Dynamic Graphs
Digital Screen Displaying Stock Market Index Data Trends
Premium
Urban skyline at night with holographic financial graphs and charts in abstract double exposure style on a digital technology background
Digital Financial Data Analysis with Vibrant Graphs
Complex Data Analytics Overlay in High-Tech Server Room
Multi-Colored Charts Superimposed Over Urban Skyline
Digital Data Visualization with Abstract Bar Graphs
Premium
A person stands with arms crossed, observing a holographic display of a rising real estate market graph. The interface shows house icons and upward arrows, symbolizing property investment and growth.
Dynamic Financial Data Chart on Green Gradient Background
Digital Stock Market Data with Upward Trend Graph
Analytics Dashboard with Dynamic Financial Data Visualization
Real-Time Financial Market Trends Visualization with Candlestick and Histogram
Premium
Businessman holding tablet and showing holographic graphs and stock market statistics gain profits. Concept of growth planning and business strategy.
Cityscape with Data Visualization Overlay Exhibiting Urban Analytics
Futuristic Data HUD Displaying Circular Analytics Overlay and Neon Waveform Charts
Digital Financial Data Analysis with Global Connections Theme
Digital Charts and Financial Data Background in Blue Tones
Abstract Financial Data Background with Dynamic Charts
Dynamic Financial Data Elements on Abstarct Grid
Premium
Businessman analyzing virtual data futuristic holographic dashboard business intelligence BI financial analysis big data visualization. stock market investment trends financial performance statistics
Abstract Data Graph Infographic on Purple Gradient Background
Digital Data Visualization in Abstract Design
Abstract Data Processing Visualization on Blue Gradient
Ukrainian Flag with Financial Graphs Depicting Economic Crisis
Premium
Doctor Holds A Holographic Graph Representing The Global Growth And Improvement Of Medical Healthcare Wealth
Dynamic Financial Data Analysis with Interactive Charts and Graphs
Digital Financial Chart and Chemical Structurals Illustration
Financial Data Overlays in Modern Office Workspace
Financial Data Overlaid on DNA with COVID-19 Imagery
Premium
Philadelphia skyline with futuristic holographic overlays, digital art on urban background, concept of technology and security. Double exposure
Dynamic Financial Data Charts Histogram
Abstract Financial Data Visualization with Graphs
Business Analytics Concept with Data Graphs and Office Desk
Digital Data Chart Visualization in Modern Office Environment
Premium
Oil pump jacks and holographic financial graphs with upward arrows in double exposure style on a sunset background, concept of market growth
Financial Data Overlaid on Server Room Showing Business Growth
Financial Data Visualization Overlaying Workspace
Digital Data Processing with DNA Helix Overlay
Colorful Stock Market Candlestick Chart on Digital Grid
Premium
Displaying shattered stone currency symbol in rocky terrain, with floating bar charts, data panels. Digital, financial, abstract, futuristic, data visualization, rugged, complex
Dynamic Data Visualization with Binary Matrix
Futuristic Financial Charts Over Night Urban Skyline
Bar Chart with Line Graph on Automotive Technology Background
Digital Candlestick Chart on Virtual Grid in Blue Tone
Premium
Close-up of hands typing on laptop keyboard with holographic business charts overlay..
Encrypted waveform visualizing secure network traffic on futuristic digital dashboard UI