- Home >
- Stock Photos >
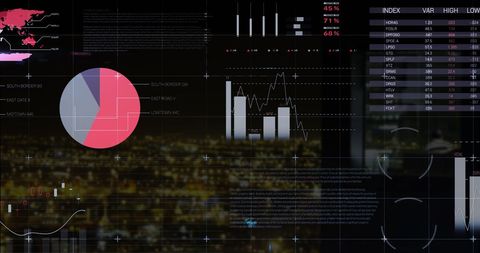
- Abstract Financial Dashboard with Data Visualization Elements
Abstract Financial Dashboard with Data Visualization Elements Image

Abstract image depicting analytics dashboard with teal and blue pie chart, surrounded by floating percentages. Offers corporate and financial insight through innovative visualization techniques. Ideal for use in presentations, reports, and promotional materials related to data analytics and technological advancements.

downloads
Tags:
More
Credit Photo
If you would like to credit the Photo, here are some ways you can do so
Text Link
photo Link
<span class="text-link">
<span>
<a target="_blank" href=https://pikwizard.com/photo/abstract-financial-dashboard-with-data-visualization-elements/d36c5960381caad5d9325172fe690908/>PikWizard</a>
</span>
</span>
<span class="image-link">
<span
style="margin: 0 0 20px 0; display: inline-block; vertical-align: middle; width: 100%;"
>
<a
target="_blank"
href="https://pikwizard.com/photo/abstract-financial-dashboard-with-data-visualization-elements/d36c5960381caad5d9325172fe690908/"
style="text-decoration: none; font-size: 10px; margin: 0;"
>
<img src="https://pikwizard.com/pw/medium/d36c5960381caad5d9325172fe690908.jpg" style="margin: 0; width: 100%;" alt="" />
<p style="font-size: 12px; margin: 0;">PikWizard</p>
</a>
</span>
</span>
Free (free of charge)
Free for personal and commercial use.
Author: Creative Art