1. Home > 
  2. Stock Photos > 
  3. Abstract Financial Data Amidst Striped Patterns

Abstract Financial Data Amidst Striped Patterns Image

Abstract Financial Data Amidst Striped Patterns

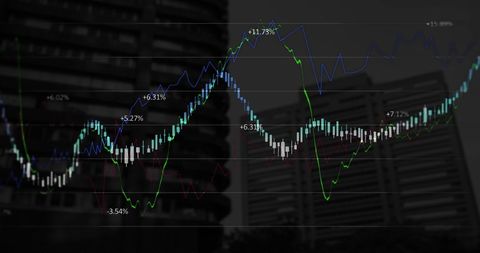
An abstract representation of shifting financial data over a background with striped patterns. Ideal for illustrating concepts of global finance, data processing, and market analysis. Useful for business presentations, financial reports, and digital content discussing economic trends or stock market behavior.

Powered by Shutterstock logo - Get 15% off with code: PIKWIZARD15
Business people with stock market chart financial trading, online investment, stock exchange analysis, market trends, real-time trading data, forex and crypto trading economic forecasting tool - Powered by Shutterstock - Get 15% off with code: PIKWIZARD15Business, finance and investment concept. Businessman analyzing stock market data with business growth graph chart, economic growth, investment planning and strategy, market research and trading - Powered by Shutterstock - Get 15% off with code: PIKWIZARD15Business, finance and investment background. Finance analyst analyzing digital marketing financial report, sale growth with stock market graph, global business planning and market research - Powered by Shutterstock - Get 15% off with code: PIKWIZARD15Stock market analysis, business, finance and investment. Finance analyst analyzing stock market trading graph, economic growth chart, planning and strategy, business investment with financial report. - Powered by Shutterstock - Get 15% off with code: PIKWIZARD15Analysis finance grow graph and market investment. Financial business plan,earnings,sale and strategy. Stock market chart, exchange financial growth diagram. - Powered by Shutterstock - Get 15% off with code: PIKWIZARD15

Credit Photo

If you would like to credit the Photo, here are some ways you can do so

Free (free of charge)

Free for personal and commercial use.

Author: People Creations

Similar Free Stock Images

Dynamic Financial Growth Representing Business Trends
Premium
Market Analysis and Trading Insights, Trader analyzes graphs and data on digital devices, modern financial technology for market evaluation and decision-making in dynamic environment
World Map with Falling Line Graphs Indicating Global Economic Decline
Dynamic Stock Market Chart with Fluctuating Trends and Data Points
Abstract Digital Financial Chart on Blue Background
Dynamic Financial Graph with Transparency Effect Overlay
Dynamic Stock Market Analysis with Digital Graph Lines
Dynamic Stock Market Visual in Modern Office Setting
Colorful Line Graphs Depicting Fluctuating Financial Trends
Stagflation Impact on Russian Economy Featuring Graph Overlay
Glowing Line Graph and White Bar Charts Over Urban Background
Abstract Financial Data With Digital Interface Graphs
Dynamic Data Analytics and Forecasting Visualization Graph
Digital Financial Chart on Black Background with Neon Lines
Holographic Financial Stock Market Analysis Visualization
Dynamic Financial Data Visualization with Abstract Graph
Futuristic Stock Market Chart Overlaying Cityscape Background
Abstract Data Visualization Graph on Blurred Background
Dynamic Digital Soundwave Pattern on Dark Background
Animated Financial Data with Heartbeat Overlapping Lines
Financial Graphs Over Urban Cityscape Illustrating Dynamic Markets
Dynamic Stock Market Graphs Over Digital Interface
Line Graphs on Digital Background Show Financial Data Trends
Abstract Financial Market Trends with Urban Lights
Dynamic Financial Data Analytics with Charts and Graphs
Digital Data Visualization and Analysis Interface
Abstract Sound Waves on Dark Background
Dynamic Global Market Trends Over World Map Visualization
Dynamic Digital Financial Data Interface Background
Premium
profit, report, strategy, financial, trade, growth, trader, chart, graph, invest. A person is using a laptop with displaying a graph of stock prices. possibly making a trade or inputting data.
Premium
Businessman analyzing forex trading graph financial data. Stock Market Investments Funds and Digital Assets. Concept of data analysis, strategy.
Data Analytics and Business Strategy Network Interface
Futuristic Stock Market Data Visualization with Graphs
Analyzing Graph Showing Market Economy Stock Crisis
Declining Stock Market Graph on Digital Background
Dynamic Financial Data Graph in Digital Grid Display
Global Financial Data Analysis with World Map Visualization
Dynamic Financial Data Analysis with Graph Overlays
Premium
Data analyzing in forex and stock market trading: the charts and summary info for making trading. Charts of financial instruments for technical analysis.
Premium
Stock market data on digital LED display. A daily market price and quotation of prices chart and candle stick tracking for Forex trading.
Armenian Flag with Financial Graph Overlay Depicting Market Trends
Abstract Financial Chart Over Modern Cityscape
Dynamic Data Visualization and Financial Growth Curves
Dynamic Stock Market Graph Showing Investment Trends
Premium
A woman signs contract and forex chart hologram. Concept of stock market analysis. Multiexposure. International business.
Digital Financial Graph and Data Display on Blue Background
Dynamic Financial Data Against Urban Skyline
Colorful Waveforms on Blue Background
Digital World Map with Dynamic Financial Analysis Overlay
Premium
Investment planing and strategy concept.
financial data analysis graph business analytics and intelligence of finance performance.
Premium
Financial accounting of profit summary graphs analysis. The business plan at the meeting and analyze financial numbers to view the performance of the company in stock market exchange.
Digital Chart Display Financial Data Analysis Background Effects
Digital Financial Data Representation with Abstract Graph
Dynamic Financial Stock Market Data Analysis
Digital Financial Data Analysis With Declining Graph
Abstract Financial Data Lines Overlay in Modern Office
Financial Growth Graph and Data Analytics Representation
Abstract Financial Graph with Bar and Line Charts on Dark Background
Financial Data Displayed with Trends on Blue Background
Financial Data Visualizations Expert Economic Impact on Urban Skyline
Displaying waveform line on digital dashboard with glowing bars, numeric tags, blue gradient
Dynamic Financial Stock Market Graph
Abstract Financial Data Technology Background
Dynamic Financial Graphs Displaying Market Trends
Premium
Planning and strategy financial portfolio and assets manager analyzing . Financial and banking
Dynamic Financial Data Analytics Display on Dark Background
Dynamic Line Graphs Displaying Financial Trends on Black Background
Analyzing Financial Charts on Digital Screen
Abstract Financial Data with Dynamic Graphs on Blue Background
Upward Stock Market Arrow with Binary Code Background
Abstract Financial Chart Overlay with Sporadic White Lines
Dynamic Music Equalizer with Blue Sound Waves on Black Background
Premium
A financial trading chart showing real-time candlestick patterns with fluctuating price movements on a dark screen, indicating market trends and investor sentiment.
Digital Finance Data Integrated with Urban Cityscape
Futuristic Financial Data Analysis with Rising White Line Graph
Digital Interface with Data Streaming on Vibrant Orange Background
Dynamic Financial Stock Exchange Data Display
Premium
Business people analyze financial data chart trading forex, Investing in stock markets, funds and digital assets, Business finance technology and investment concept, Business finance background.
Premium
A financial professional analyzing stock market data on a computer with a digital graph overlay. Background of financial concept
Fluctuating Financial Graph with Red Line on Green Grid
Dynamic Stock Market Data Visualization on Digital Interface Background
Financial Data Processing with Rising Graphs
Digital Stock Market Data Analysis in Blue Tones
Financial Data Visualization with Rising Trends
Dynamic Financial Data Analytics Interface with Blue Background
Digital Charts and Financial Data Background in Blue Tones
Premium
Digital data indicator analysis on financial market trade chart on LED. Concept Stock data trade. Double exposure style
Premium
Crypto investor analyst broker analyzing financial stock trade stockmarket exchange platform indexes digital chart data on computer screen thinking of stockmarket invest analytics risk. Over shoulder
Changing Numbers on Computer Interface with Graph Lines
Financial Data Analysis with Dynamic Charts and Graphs
Futuristic Stock Market Graph With Digital Overlay
Digital Equalizer and Sound Waves on Black Background
Digital Financial Analysis Overlay on Plastic Bottle Manufacturing
Premium
Finance data concept. Analytics report status information of stock market in digital screen. which including of candle stick trend and digital number synbol.
Fluctuating Stock Market Graph with Dramatic Peaks
Financial Market Data Visualization with Line Graph and Candlesticks
Financial Data with World Map and Digital Waves
Premium
Data analyzing in Forex, Commodities, Equities, Fixed Income and Emerging Markets: the charts and summary info show about "Business statistics and Analytics value". To make decision about BUY or SELL.
Premium
Businesswoman analyzing financial data, writing on a notepad in front of a laptop. Financial graphs overlay on office background. Concept of market analytics and strategy
Premium
Stock market analysis concept. Trading trading chart. Financial investment. Finance. Forex graph. A man is using a laptop to type on a keyboard. The laptop screen shows a graph of stock prices.
Abstract Financial Stock Market Graph Overlay on Digital Interface
Neon Network on Purple Background with Glowing Connectivity Lines
Dynamic Stock Market Data on Digital Interface
Rising Financial Market Trends with Data Visualization
Premium
Investors analyze graph data stock market index via digital tablet screen to trade the stock chart for planning investments take profit, trade stock exchange market and cryptocurrency data, financial.
Premium
Asian businessman checking stock market data, Stock market application for iPad, Analyzing stock market data on desktop, Young businessman with stock market chart background
Innovative Stock Market Analysis Illustration with Digital Graphs
Digital Financial Data Overlay on Urban Cityscape Background
Colorful Data Chart Over Blue Background
Digital Financial Data Visualization with Graph and Metrics
Premium
Finance, account, investment concept. Analyzing stock market data, financial graph report, economic growth, business strategy, planning, solution, currency exchange, market research, economy analysis
Cityscape with Digital Graphs Overlaid Representing Data Analysis
Financial Data Line Graph on Digital Display
Financial Data Projection Over Blurred Cityscape
Premium
Businessman analyzing stock market data analysis with digital charts on laptop and smartphone, financial trends, forex trading strategies, and investment growth.
Premium
Multiple graphs and charts showing financial data on screen. Bright colors highlighting different types of stock market trends and statistics
Dynamic Financial Market Trends with Data Visualizations
Abstract Neon Waves on Dark Background Concept
Financial Data Analysis in Digital Interface with Graphs
Premium
Digital money movement chart with crypto falling in price down to zero due to panic sell off by investors and traders reacting to negative news, red candlestick graph showing bear stock market crash
Premium
Business data analysis, strategy and planning for business development. Businessman analyzing financial graph growth chart, digital marketing, finance and smart investment
Financial Data Overlay on Urban Skyscrapers
Surprising Drop in Digital Stock Market Chart Visualization
Colorful Digital Waveform Represents Global Connections
Digital Financial Data Visualizations on Blue Interface
Explore More Free Stock Images