
- Home >
- Stock Photos >
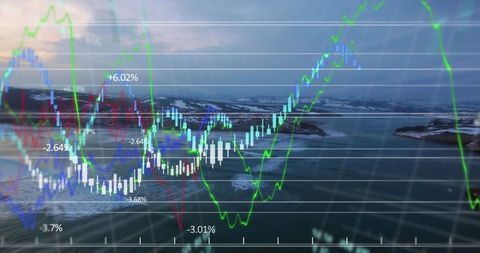
- Abstract Financial Data Analysis Graphs with Digital Interface
Abstract Financial Data Analysis Graphs with Digital Interface Image

This dynamic depiction of financial data analysis includes graphs and digital interface illustrations with bright neon elements. Perfect for use in presentations, financial reports, or articles discussing market trends, financial technologies, and data analysis methodologies. Suitable for backgrounds in technology leading literature where a futuristic finance theme is required.
Powered by 


downloads
Tags:
More
Credit Photo
If you would like to credit the Photo, here are some ways you can do so
Text Link
photo Link
<span class="text-link">
<span>
<a target="_blank" href=https://pikwizard.com/photo/abstract-financial-data-analysis-graphs-with-digital-interface/eaa22fc2400b50a5822570b00c177828/>PikWizard</a>
</span>
</span>
<span class="image-link">
<span
style="margin: 0 0 20px 0; display: inline-block; vertical-align: middle; width: 100%;"
>
<a
target="_blank"
href="https://pikwizard.com/photo/abstract-financial-data-analysis-graphs-with-digital-interface/eaa22fc2400b50a5822570b00c177828/"
style="text-decoration: none; font-size: 10px; margin: 0;"
>
<img src="https://pikwizard.com/pw/medium/eaa22fc2400b50a5822570b00c177828.jpg" style="margin: 0; width: 100%;" alt="" />
<p style="font-size: 12px; margin: 0;">PikWizard</p>
</a>
</span>
</span>
Free (free of charge)
Free for personal and commercial use.
Author: Authentic Images
Similar Free Stock Images

Premium


Premium


Premium


Premium


Premium


Premium


Premium


Premium


Premium


Premium


Premium

Premium


Premium


Premium


Premium


Premium


Premium

Premium


Premium

Premium


Premium


Premium

Premium


Premium


Premium

Explore More Free Stock Images