- Home >
- Stock Photos >
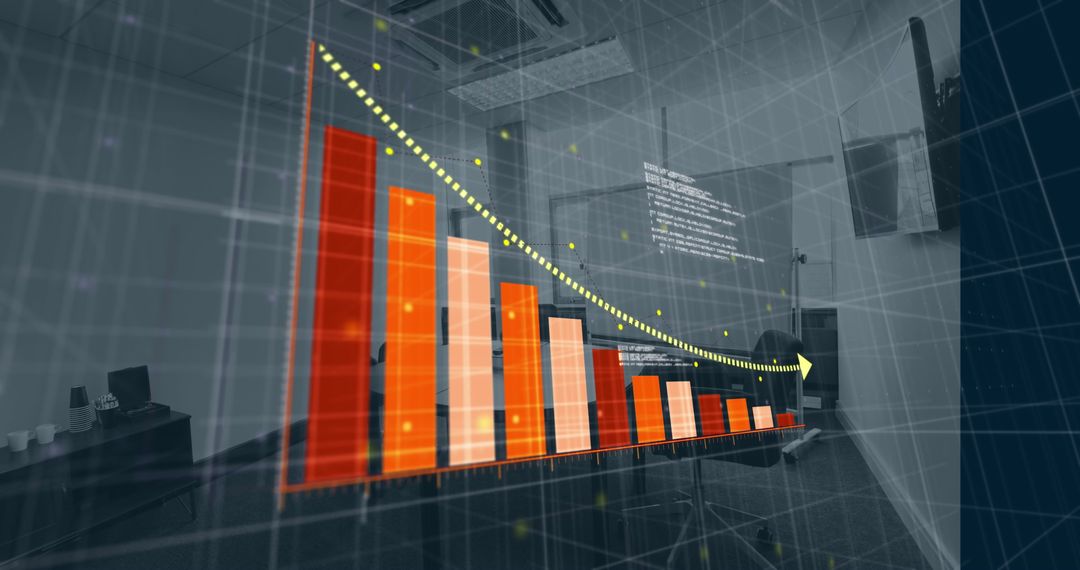
- Abstract Financial Data Analysis with Bar and Line Graphs
Abstract Financial Data Analysis with Bar and Line Graphs Image

Abstract visualization of financial data processing showing dynamic interaction of bar graphs and line charts on a grid backdrop. Perfect for illustrating complex economic analysis, digital finance technologies, or business presentations in corporate settings.
Powered by  - Get 15% off with code: PIKWIZARD15


0
downloads
downloads
Tags:
More
Credit Photo
If you would like to credit the Photo, here are some ways you can do so
Text Link
photo Link
<span class="text-link">
<span>
<a target="_blank" href=https://pikwizard.com/photo/abstract-financial-data-analysis-with-bar-and-line-graphs/9a016721adbb4c7ae5693059351c2b9c/>PikWizard</a>
</span>
</span>
<span class="image-link">
<span
style="margin: 0 0 20px 0; display: inline-block; vertical-align: middle; width: 100%;"
>
<a
target="_blank"
href="https://pikwizard.com/photo/abstract-financial-data-analysis-with-bar-and-line-graphs/9a016721adbb4c7ae5693059351c2b9c/"
style="text-decoration: none; font-size: 10px; margin: 0;"
>
<img src="https://pikwizard.com/pw/medium/9a016721adbb4c7ae5693059351c2b9c.jpg" style="margin: 0; width: 100%;" alt="" />
<p style="font-size: 12px; margin: 0;">PikWizard</p>
</a>
</span>
</span>
Free (free of charge)
Free for personal and commercial use.
Author: People Creations
Similar Free Stock Images

Premium


Premium


Premium


Premium


Premium


Premium


Premium


Premium


Premium


Premium


Premium


Premium


Premium


Premium


Premium


Premium


Premium


Premium


Premium


Premium


Premium


Premium


Premium


Premium