
- Home >
- Stock Photos >
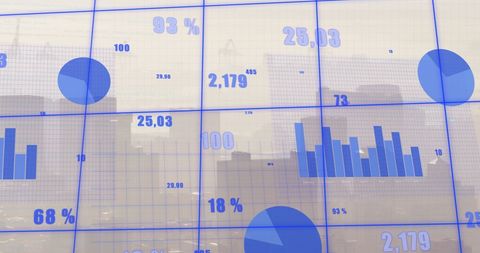
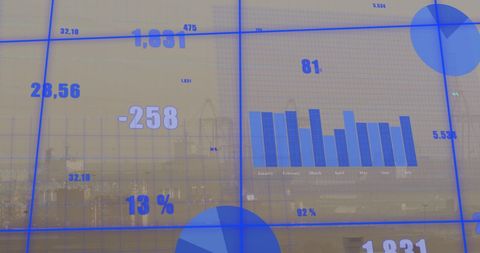
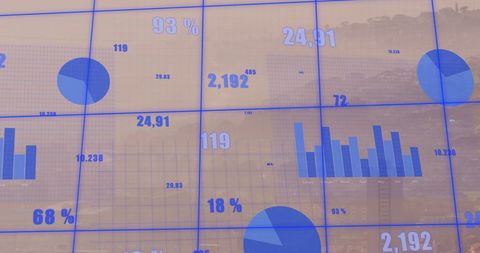
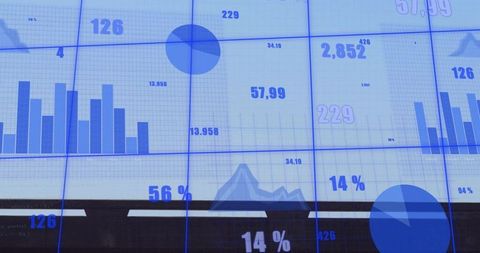
- Abstract Financial Data Analysis with Digital Graphs
Abstract Financial Data Analysis with Digital Graphs Image

Digital financial data analysis with graphs displays statistical information overlaid on a dynamic blue grid. Ideal for illustrating financial reports, global business strategies, or data-driven financial concepts, emphasizing technology in modern economics.
Powered by 


downloads
Tags:
More
Credit Photo
If you would like to credit the Photo, here are some ways you can do so
Text Link
photo Link
<span class="text-link">
<span>
<a target="_blank" href=https://pikwizard.com/photo/abstract-financial-data-analysis-with-digital-graphs/b9a56e860e5a7946bcd0d01df7983695/>PikWizard</a>
</span>
</span>
<span class="image-link">
<span
style="margin: 0 0 20px 0; display: inline-block; vertical-align: middle; width: 100%;"
>
<a
target="_blank"
href="https://pikwizard.com/photo/abstract-financial-data-analysis-with-digital-graphs/b9a56e860e5a7946bcd0d01df7983695/"
style="text-decoration: none; font-size: 10px; margin: 0;"
>
<img src="https://pikwizard.com/pw/medium/b9a56e860e5a7946bcd0d01df7983695.jpg" style="margin: 0; width: 100%;" alt="" />
<p style="font-size: 12px; margin: 0;">PikWizard</p>
</a>
</span>
</span>
Free (free of charge)
Free for personal and commercial use.
Author: People Creations
Similar Free Stock Images

Premium


Premium


Premium

Premium


Premium

Premium


Premium

Premium


Premium


Premium


Premium

Premium

Premium


Premium


Premium

Premium


Premium


Premium


Premium


Premium


Premium


Premium


Premium


Premium


Premium

Explore More Free Stock Images