
- Home >
- Stock Photos >
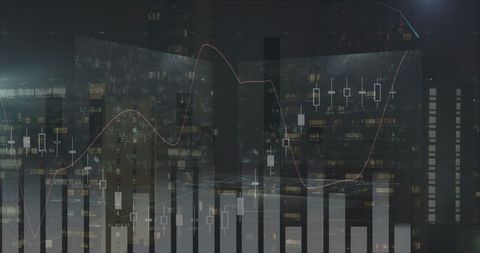
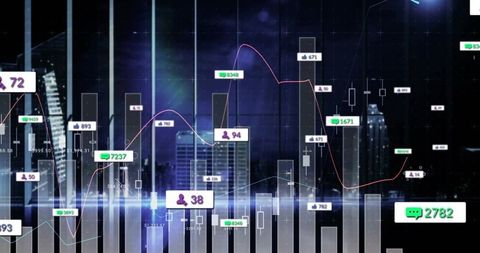
- Abstract Financial Data Analysis with Graphs and Equations
Abstract Financial Data Analysis with Graphs and Equations Image

Futuristic illustration visualizing financial data and statistical analysis surfaces through multiple graphical lines and equations. Ideal for articles, presentations, or reports on business analytics, financial forecasts, and technology in finance. Also useful for educational materials on data processing and statistical computations.
Powered by 


downloads
Tags:
More
Credit Photo
If you would like to credit the Photo, here are some ways you can do so
Text Link
photo Link
<span class="text-link">
<span>
<a target="_blank" href=https://pikwizard.com/photo/abstract-financial-data-analysis-with-graphs-and-equations/43f1bbae759ebc4cb5f650eca1b40552/>PikWizard</a>
</span>
</span>
<span class="image-link">
<span
style="margin: 0 0 20px 0; display: inline-block; vertical-align: middle; width: 100%;"
>
<a
target="_blank"
href="https://pikwizard.com/photo/abstract-financial-data-analysis-with-graphs-and-equations/43f1bbae759ebc4cb5f650eca1b40552/"
style="text-decoration: none; font-size: 10px; margin: 0;"
>
<img src="https://pikwizard.com/pw/medium/43f1bbae759ebc4cb5f650eca1b40552.jpg" style="margin: 0; width: 100%;" alt="" />
<p style="font-size: 12px; margin: 0;">PikWizard</p>
</a>
</span>
</span>
Free (free of charge)
Free for personal and commercial use.
Author: Creative Art
Similar Free Stock Images

Premium


Premium

Premium


Premium


Premium


Premium


Premium

Premium


Premium


Premium

Premium


Premium

Premium


Premium

Premium


Premium


Premium


Premium


Premium


Premium

Premium

Premium


Premium


Premium


Premium


Explore More Free Stock Images