
- Home >
- Stock Photos >
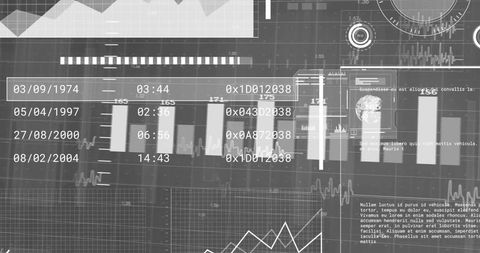
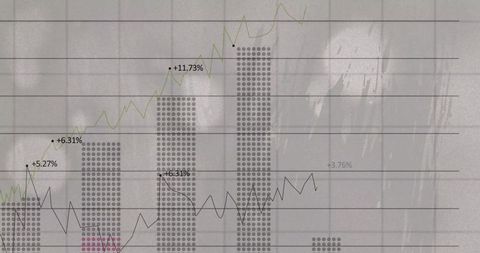
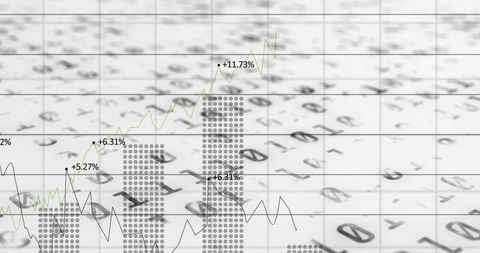
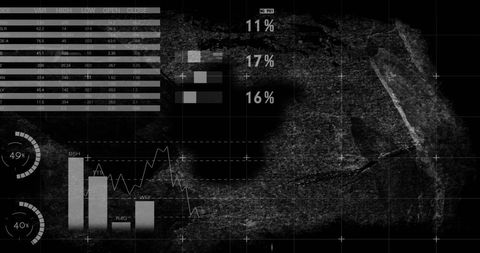
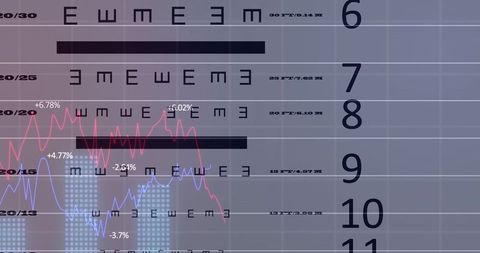
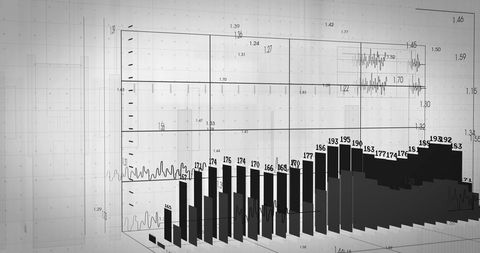
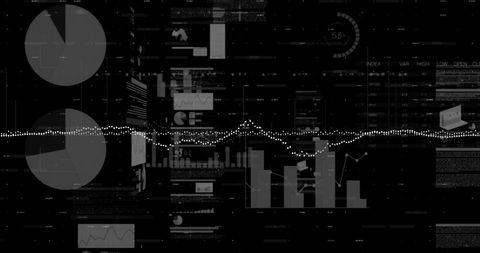
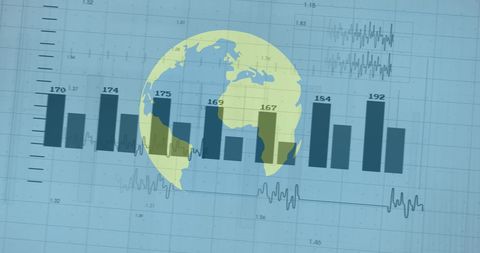
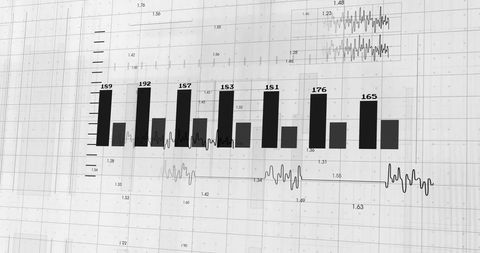
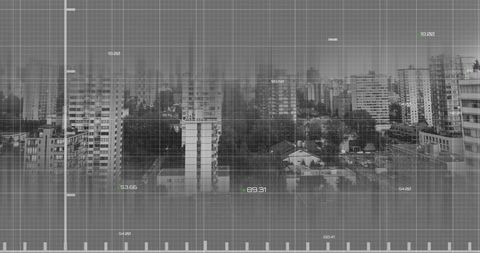
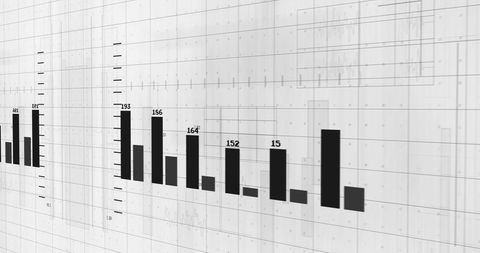
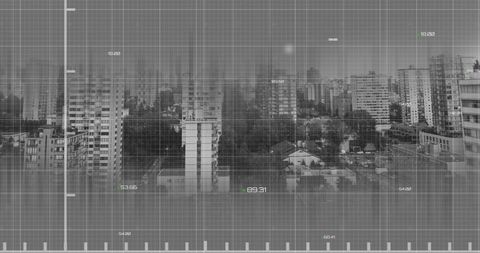
- Abstract Financial Data Analysis with Graphs and Numbers
Abstract Financial Data Analysis with Graphs and Numbers Image
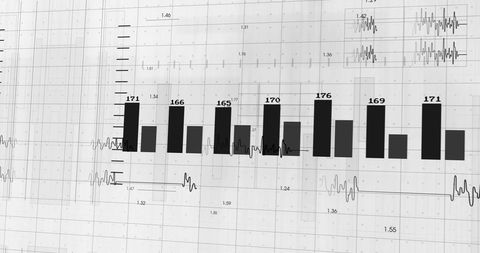
Illustration captures abstract view of financial data analysis with black graphs and numbers on white background. Depicts elements of business intelligence and finance with a focus on statistical data representation. Useful for corporate presentations, finance reports, and digital business editorial content.
Powered by 


downloads
Tags:
More
Credit Photo
If you would like to credit the Photo, here are some ways you can do so
Text Link
photo Link
<span class="text-link">
<span>
<a target="_blank" href=https://pikwizard.com/photo/abstract-financial-data-analysis-with-graphs-and-numbers/b43c29fc5e5daa7644d240caacf3bee7/>PikWizard</a>
</span>
</span>
<span class="image-link">
<span
style="margin: 0 0 20px 0; display: inline-block; vertical-align: middle; width: 100%;"
>
<a
target="_blank"
href="https://pikwizard.com/photo/abstract-financial-data-analysis-with-graphs-and-numbers/b43c29fc5e5daa7644d240caacf3bee7/"
style="text-decoration: none; font-size: 10px; margin: 0;"
>
<img src="https://pikwizard.com/pw/medium/b43c29fc5e5daa7644d240caacf3bee7.jpg" style="margin: 0; width: 100%;" alt="" />
<p style="font-size: 12px; margin: 0;">PikWizard</p>
</a>
</span>
</span>
Free (free of charge)
Free for personal and commercial use.
Author: Creative Art
Similar Free Stock Images

Premium


Premium


Premium


Premium


Premium


Premium

Premium


Premium

Premium


Premium


Premium

Premium


Premium


Premium


Premium

Premium


Premium


Premium


Premium


Premium

Premium


Premium


Premium


Premium


Premium

Explore More Free Stock Images