
- Home >
- Stock Photos >
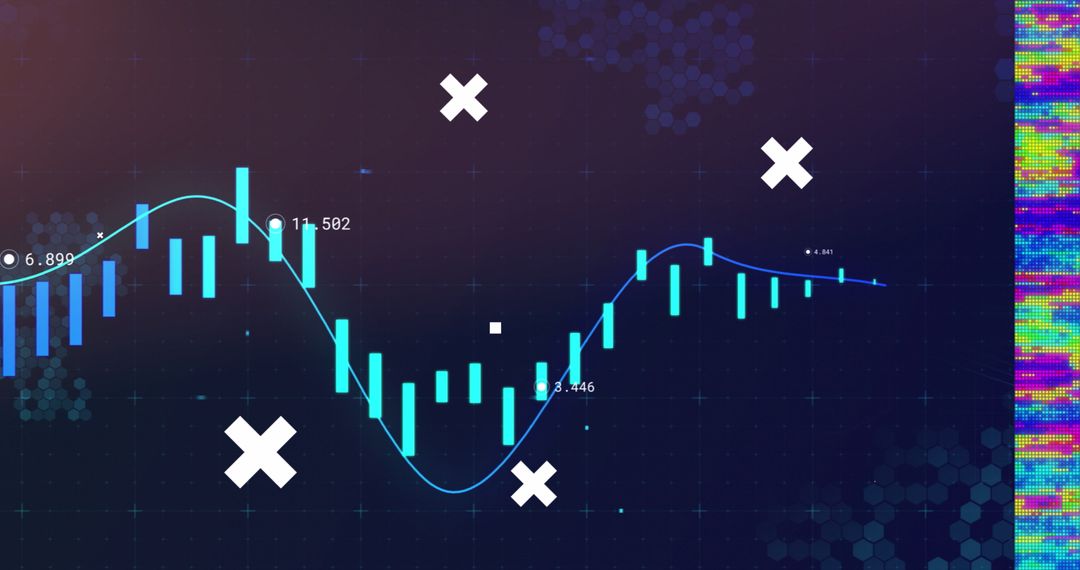
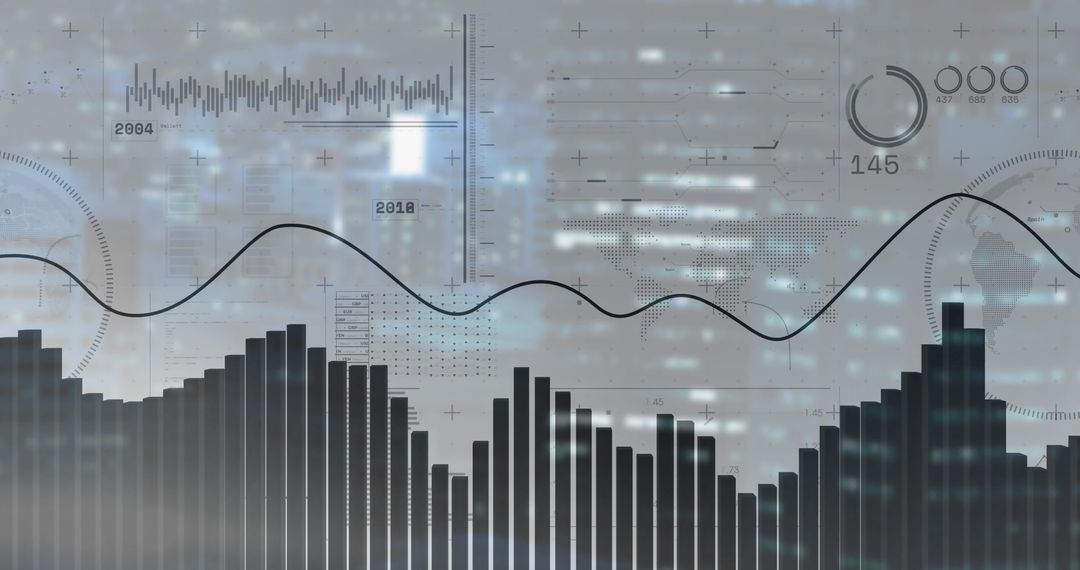
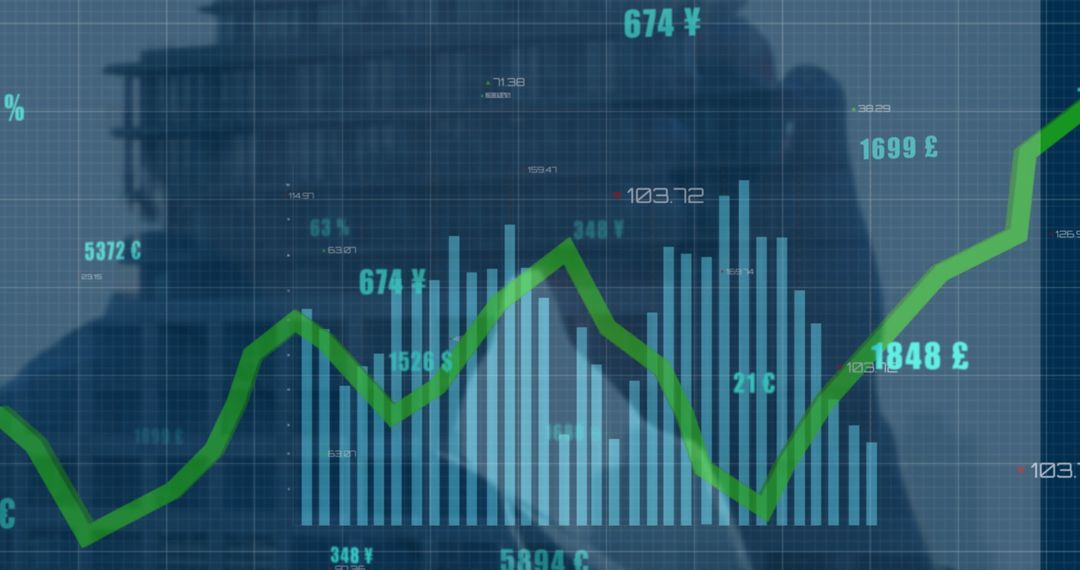
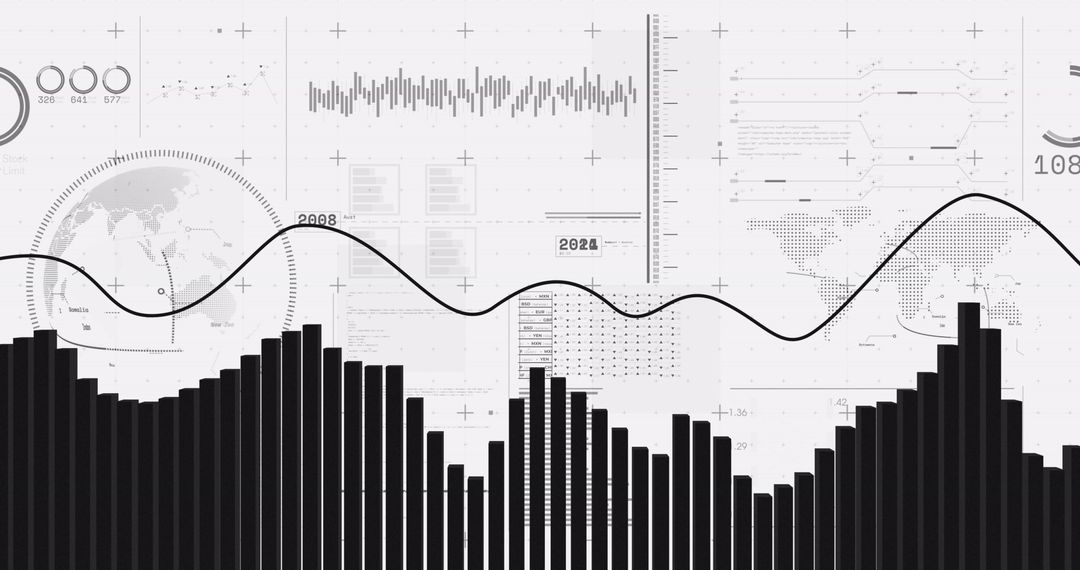
- Abstract Financial Data Analysis with Graphs and Trends
Abstract Financial Data Analysis with Graphs and Trends Image

Capturing elements of financial data analysis with line graphs and numerical trends, this image is suitable for presentations, reports, and websites focused on finance, data analytics, or economic trends. Ideal for illustrating advanced analytics concepts or showcasing technological advancements in lucrative industries.
Powered by 


2
downloads
downloads
Tags:
More
Credit Photo
If you would like to credit the Photo, here are some ways you can do so
Text Link
photo Link
<span class="text-link">
<span>
<a target="_blank" href=https://pikwizard.com/photo/abstract-financial-data-analysis-with-graphs-and-trends/b84f781c5346b61889ab379f3c4c0818/>PikWizard</a>
</span>
</span>
<span class="image-link">
<span
style="margin: 0 0 20px 0; display: inline-block; vertical-align: middle; width: 100%;"
>
<a
target="_blank"
href="https://pikwizard.com/photo/abstract-financial-data-analysis-with-graphs-and-trends/b84f781c5346b61889ab379f3c4c0818/"
style="text-decoration: none; font-size: 10px; margin: 0;"
>
<img src="https://pikwizard.com/pw/medium/b84f781c5346b61889ab379f3c4c0818.jpg" style="margin: 0; width: 100%;" alt="" />
<p style="font-size: 12px; margin: 0;">PikWizard</p>
</a>
</span>
</span>
Free (free of charge)
Free for personal and commercial use.
Author: Authentic Images
Similar Free Stock Images
Premium


Premium


Premium


Premium


Premium


Premium


Premium


Premium


Premium


Premium


Premium


Premium


Premium


Premium


Premium


Premium


Premium


Premium


Premium


Premium


Premium


Premium


Premium


Premium

