- Home >
- Stock Photos >
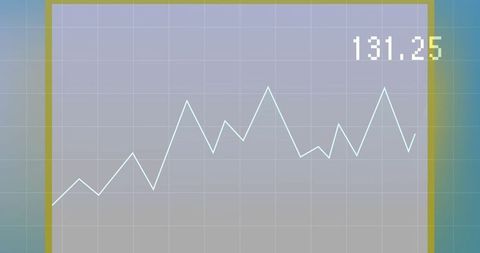
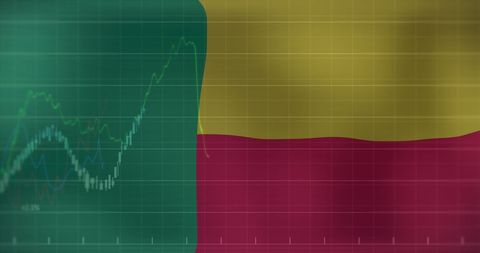
- Abstract Financial Data Analytics on Dark Grid Background
Abstract Financial Data Analytics on Dark Grid Background Image

Visual representation combines digital pie and line charts over grid background, suitable for illustrating trends or tools in finance, analytics, business strategy, or data-driven decision-making across multiple digital platforms.

downloads
Tags:
More
Credit Photo
If you would like to credit the Photo, here are some ways you can do so
Text Link
photo Link
<span class="text-link">
<span>
<a target="_blank" href=https://pikwizard.com/photo/abstract-financial-data-analytics-on-dark-grid-background/9d383e5ff1177df6105a4d785b7d4791/>PikWizard</a>
</span>
</span>
<span class="image-link">
<span
style="margin: 0 0 20px 0; display: inline-block; vertical-align: middle; width: 100%;"
>
<a
target="_blank"
href="https://pikwizard.com/photo/abstract-financial-data-analytics-on-dark-grid-background/9d383e5ff1177df6105a4d785b7d4791/"
style="text-decoration: none; font-size: 10px; margin: 0;"
>
<img src="https://pikwizard.com/pw/medium/9d383e5ff1177df6105a4d785b7d4791.jpg" style="margin: 0; width: 100%;" alt="" />
<p style="font-size: 12px; margin: 0;">PikWizard</p>
</a>
</span>
</span>
Free (free of charge)
Free for personal and commercial use.
Author: Authentic Images