1. Home > 
  2. Stock Photos > 
  3. Abstract Financial Data Analytics with Graphs and Numbers

Abstract Financial Data Analytics with Graphs and Numbers Image

Abstract Financial Data Analytics with Graphs and Numbers

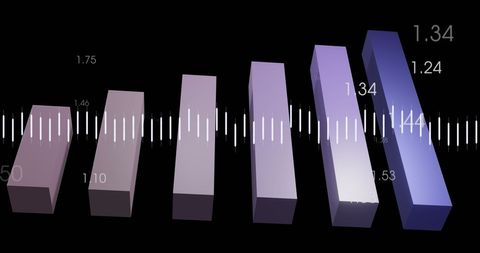
Image features abstract 3D bar graphs with numerical values on dark backdrop, representing analytics in finance and business. Suitable for illustrating financial reports, digital marketing, scientific articles, or educational content about data analysis and technology in economic sectors.

Powered by Shutterstock logo - Get 15% off with code: PIKWIZARD15
Big data analytics with AI technology. Data analyst analyzing and visualizing complex information network with artificial intelligence. Machine learning algorithm for business analytics and finance. - Powered by Shutterstock - Get 15% off with code: PIKWIZARD15Man look at the dashboard with graphs and charts. Concept of data management system, business intelligence, data statistics, marketing analysis, key performance indicators (KPI) and analytics. - Powered by Shutterstock - Get 15% off with code: PIKWIZARD15Man look at the dashboard with graphs and charts. Concept of data management system, business intelligence, data statistics, marketing analysis, key performance indicators (KPI) and analytics. - Powered by Shutterstock - Get 15% off with code: PIKWIZARD15Scientist working with business data, finance, marketing report, Big Data Analytics technology, Processing Complexity information flow on virtual screen, machine learning, artificial intelligence, ML - Powered by Shutterstock - Get 15% off with code: PIKWIZARD15Data science. Innovation technology, digital software development concept. Algorithm and deep learning of AI artificial intelligence, data engineering and global network. data processing technology. - Powered by Shutterstock - Get 15% off with code: PIKWIZARD15

Credit Photo

If you would like to credit the Photo, here are some ways you can do so

Free (free of charge)

Free for personal and commercial use.

Author: People Creations

Similar Free Stock Images

Closeup of Colorful Chalk on Black Background
Premium
Businessman analyze and visualize complex information on a virtual screen using AI to process data. Big data technology and data science.Data flow.Digital neural network.artificial intelligence
Colorful Pencils Arranged in Creative Interlock Pattern
Children Completing Obstacle Course in Outdoor Boot Camp
Dynamic Digital Financial Data Visualization on Dark Background
Data Analysis and Global Business Conceptual Illustration
Premium
Expert woman asian female people review data number costing managerial account prepare monthly actual cost variance report at tax audit office. ESG sheet budget control ERP process service project.
Hypnotic Multicolored Neon Light Trails in Motion
Glowing Neon Pink Abstract Tunnel with Geometric Shapes
Creative Happy Teacher's Day with Pencils and Notebook
Dynamic Data Interface with Futuristic Visualization in Business Environment
Premium
business intelligence BI concept, financial charts to analyze profit and finance performance of company, hands typing on computer on background
Abstract Digital Chart in Futuristic Financial Analysis Concept
Creative Art Supplies on Rustic Wooden Table with Copy Space
Organized Colored Pencils Displayed in Gradient Pattern on White Background
Colorful Pencils in Rows on Graph Paper for Art and Education
Premium
cloud technology concept Global network of metaverse systems exchange of information global business Megatrends on the Internet for Telecommunication
Colorful Spectrum of Pencils for Creativity and Organization
Vibrant Close-Up of Multicolored Pencils on White Background
Gymnast Balancing on Beam in Indoor Arena
Gymnast Prepares on Balance Beam with Focus and Determination
Premium
close up ceo businesswoman hand point on dashboard screen tablet device for ask and share idea or consulting with businessman partner for business team and work from home concept
Chinese Economic Growth Depicted by Rising Bars and Flag Background
Abstract Financial Data Visualization with Graphs and Charts
DNA Helix Overlay with Mathematical Equations on Black Background
Digital Infographic on Global Data Over Planet Earth
Premium
Image of financial data processing over grid. Global business, finance, computing and data processing concept digitally generated image.
School and Education Icons on Chalkboard Background
Abstract Global Data Visualization with Geometric Overlays
Futuristic Blue Light Beams Creating Geometric Patterns
Dynamic Bar Chart on Black Background Reflecting Data Analysis
Colorful Chalks in Formation on Blackboard
Gymnast Practicing Balance Beam Skill with Concentration and Precision
Premium
Risk assessment and management concept, Business Woman touch on Low levels of risk management, Evaluation measure analytics technology, Business, Financial, Health, Human resource, Insurance
Schoolboy Writing at Desk with Blackboard Background in Classroom Illustration
Abstract Financial Data Background with Dynamic Charts
Abstract Financial Data with White Graph Against Dark Blue Background
Digital Data Visualization with Vibrant Bars and Lines on Blue
Premium
Data science, business analysis and strategy, big data concept.Business teamwork analyzing financial graph on virtual touch screen, futuristic technology solution for business development
Illustration of Woman Presented Against Chalkboard Background
Close-Up of Multicolored Pencils for Creativity and Education
Colorful Pencils and Clips on Dark Background with Copy Space
3D Bar Graph on Digital Binary Background, Financial Data Concept
Premium
Business Analytics (BA) technology uses data mining, automation and predictive modeling for useful insights and decision making, concept with icons on a virtual screen with consultant in background
Colorful Array of Sharp Pencils Lined on Wooden Surface
Colorful Pencils Forming Heart Shape Symbolizing Artistic Passion
Vibrant Colored Pencils Aligned for Creative Expression
Colorful Pencils on White Background for Creative Projects
Premium
Big data and AI technology, Business intelligence and AI data science, Automating data processing, Machine learning and business intelligence, AI driven data processing, KPI performance monitoring.
Female Gymnast Perfecting Balance Routine on Beam in Studio
Female Gymnast Practicing Skill in Gymnastics Studio
Gymnast Preparing for Balance Beam Routine with Chalk
Green Question Marks Floating Over Complex Grey Maze
Premium
Image of financial data processing over dark background. global connections, data processing and digital interface concept digitally generated image.
3D Bar and Line Graphs Showing Financial Data Analytics
Colorful Stationery on Wooden Desk Background
Digital Financial Data Visualization with Bar and Line Graph
Creative School Supplies Icons against Grey Background
Premium
Business data analytics and robotic process automation management with a consultant touching connected gear cogs with KPI financial charts and graph, marketing dashboard
Financial Data Analytics Overlaying Digital World Map Background
Caucasian Female Gymnast in Arena with Financial Data Overlay
Colorful Pencils on Blue Background with Blank Space
Digital File Organization Concept with Folder Icons
Focused Gymnast Prepares with Chalk on Balance Beam
Fit Man Balancing on Outdoor Obstacle Course Beam
Premium
Business development and technology Data analyst for report marketing strategy planning. graph analysis and information on a futuristic virtual interface screen.
Graph with Data Background Highlighting Market Trends
Financial Data Analysis with Bar Chart
Abstract Data Visualization with Growing Charts
Minimalist White Cross on Dark Background Symbolizing Christianity
Premium
Back rear view of young asian woman, freelance data scientist work remotely at home coding programmer on Big data mining, AI data engineering, IT Technician Works on Artificial Intelligence Project.
Digital Interface Conceptualizing Monthly Data Trends
Vibrant Colored Pencils on Light Blue Background
Close-Up of Grey Cinder Blocks on Street Surface
Women Balancing on Beam for Outdoor Fitness Challenge
Premium
Analytical data and development statistics. Web analytics and product testing techniques are being measured. A guy studies an SEO dashboard and a digital report.
Sharpened Yellow Pencil with Ample White Copy Space
Row of Colored Pencils on White Background with Copy Space
Close-Up Perspective of Colored Pencils Displaying Bright Spectrum
Colorful Pencils Arranged in Semi-Circle on White Space
Premium
Data document content management system search and online file transfer download or doc sharing and database digital cloud drive storage service on computer network technology analytics concepts
Gymnast Practicing on Balance Beam in Colorful Attire
Rising Bar Chart with Red Arrow Indicating Growth
Stack of Books with Animated Mathematical Concepts
High-Tech Financial Data Chart with 3D Bars and Graphs
Premium
Finance Technology: Businessman using laptop and analyzing financial data information on futuristic virtual interface screen, blockchain, digital payments, AI algorithms, investment strategies.
Digital Graph and Statistics Overlay on Shipyard Background
Colorful School Supplies on Gradient Background
Dynamic Stock Market Data with Engineer in High-Tech Server Room
Binary Coding and Digital Data Visualization Concept
Premium
Businesswoman working with business data, finance, marketing report, Big Data Analytics technology, Processing Complexity information flow on virtual screen, machine learning, artificial intelligence.
3D Financial Data Chart on Futuristic Purple Background
Abstract Black and White Geometric Spiral Design
Female Gymnast Practicing on Balance Beam Close Up
Female Gymnast Balancing on Beam in Gymnasium
Fit Man Balancing on Beam During Obstacle Course Training Outdoors
Glowing Neon Blue Lines on Black Background Looping Animation
Premium
Data analysis science and big data with AI technology. Analyst or Scientist uses a computer and dashboard for analysis of information on complex data sets on computer. Insights development engineer
Abstract Financial Data Analysis on Blue Background
Dynamic Digital Financial Analysis with 3D Graphics
Glowing Neon Pink Abstract Tunnel on Black Background
Economic Growth Chart Overlaying Ukrainian Flag Theme
Premium
Data science. Man programmer using digital tablet computer analyzing and develop software on futuristic virtual interface screen. Algorithm, big data analysis and management, data visualization
Futuristic Data Visualization with Bar Graphs and Digital Interface
Red Arrow Over Increasing Bar Chart in Digital Background
Outdoor Fitness Enthusiast Jumping Over Wooden Barrier in Park
Colorful Pencils Creating Artistic Abstract Pattern on White Surface
Premium
Image of financial data processing over diverse business people in office. Global finance, business, connections, computing and data processing concept digitally generated image.
Colorful Pencils Aligned Creatively on White Surface
Vibrant Gradient of Colored Pencils on White Background
Colorful Pencils Aligning Creativity Against White Backdrop
Young Gymnast Balancing Skillfully on Beam in Studio
Premium
Man Typing Keyboard Laptop Hand.Project Manager Researching Process.Business Team Working Startup modern Office.Global Strategy Virtual Icon.Innovation Graphs Interfaces.Analyze market stock.Blurred
Question Marks Hovering Over Complex Gray Maze Background
Colorful Pencils with Light Pastel Filter Brighten Creative Spaces
Analyzing Global Financial Data with Digital Bar Graphs
Financial Data Processing Over Black Background with Error Messages
Premium
Digital business marketing data management on virtual screen, Businessman use laptop work marketing analysis chart strategic planning analytics dashboard with management data work in modern office
Yellow Pencil Icon on Blue Gradient Background
Digital Bar Chart Data Visualization on Blue Background
Dynamic Financial Data Represented in Vertical Bars on Purple Background
Colorful Pencils Lined Up on White Background
Premium
AI agent and intelligent automation IA technology. Business process automation BPA system. Businessman using laptop computer to give instructions to AI at desk in office.
3D Bar Chart with Subscribe Text on Navy Background