- Home >
- Stock Photos >
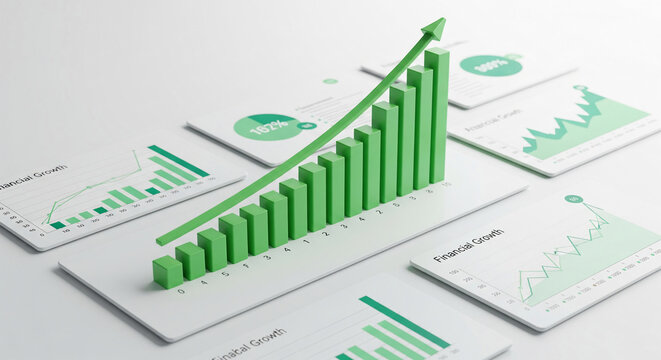
- Abstract Financial Data and Analysis Dashboard with Rising Graphs
Abstract Financial Data and Analysis Dashboard with Rising Graphs Image

Conceptual visualization of a financial data analysis dashboard with dynamic graphs. Abstract design featuring digital screens, representing stock market trends and analytics processes. Ideal for use in financial technology presentations, investment analysis brochures, fintech marketing materials, and business growth campaigns.
Powered by 


2
downloads
downloads
Tags:
More
Credit Photo
If you would like to credit the Photo, here are some ways you can do so
Text Link
photo Link
<span class="text-link">
<span>
<a target="_blank" href=https://pikwizard.com/photo/abstract-financial-data-and-analysis-dashboard-with-rising-graphs/2785c130fba7eeb0bf92c0cabbe19889/>PikWizard</a>
</span>
</span>
<span class="image-link">
<span
style="margin: 0 0 20px 0; display: inline-block; vertical-align: middle; width: 100%;"
>
<a
target="_blank"
href="https://pikwizard.com/photo/abstract-financial-data-and-analysis-dashboard-with-rising-graphs/2785c130fba7eeb0bf92c0cabbe19889/"
style="text-decoration: none; font-size: 10px; margin: 0;"
>
<img src="https://pikwizard.com/pw/medium/2785c130fba7eeb0bf92c0cabbe19889.jpg" style="margin: 0; width: 100%;" alt="" />
<p style="font-size: 12px; margin: 0;">PikWizard</p>
</a>
</span>
</span>
Free (free of charge)
Free for personal and commercial use.
Author: Awesome Content
Similar Free Stock Images

Premium


Premium


Premium


Premium


Premium


Premium


Premium


Premium


Premium


Premium


Premium


Premium


Premium


Premium


Premium


Premium


Premium


Premium


Premium


Premium


Premium


Premium


Premium


Premium