1. Home > 
  2. Stock Photos > 
  3. Abstract Financial Data and Analytics Background

Abstract Financial Data and Analytics Background Image

Abstract Financial Data and Analytics Background

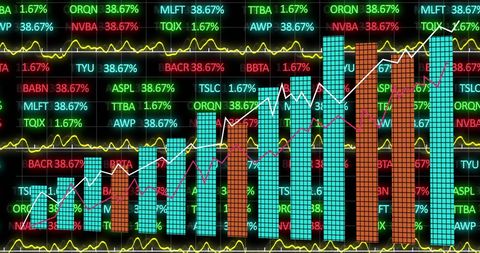
Graphical depiction of financial data featuring market analytics emphasizes data-driven trades. Useful for themes involving global finance, business strategy discussions, fintech innovations, and stock market insights.

Powered by Adobe logo
Isometric data analytics platform with a growing bar chart. Digital technology and business intelligence concept for financial growth. - Powered by Adobe
Dynamic blue and green digital stock market graph with bar charts and lines on a dark background, representing financial data analysis, investment trends, business growth, and global economy fluctuat - Powered by AdobeGlobal financial trading chart with glowing blue bars and world map on digital interface background illustrating business data and economy concept. Ai generative - Powered by AdobeBusinesswoman working on laptop with digital data charts and analytics dashboard overlay, representing business intelligence, data analysis, financial reports, and modern technology solutions. - Powered by AdobeBusiness professionals collaborating and analyzing financial data on a laptop with charts and graphs during a meeting - Powered by Adobe

Credit Photo

If you would like to credit the Photo, here are some ways you can do so

Free (free of charge)

Free for personal and commercial use.

Author: People Creations

Similar Free Stock Images

Loading...
Dynamic Stock Market Ticker and Graph Analysis
Premium
Businesswoman analyzing data on computer monitors, focused on reviewing breach report and security statistics in modern office
Dynamic Stock Market Data Display with Charts and Numbers
Premium
Data analytics and big data strategy for real-time analytics, predictive data modeling, business intelligence analytics, and data-driven decision-making in modern digital businesses. Thunk
Premium
Abstract digital stock market chart with glowing blue lines and bokeh effects representing financial growth and analysis.
Dynamic Financial Data Analysis Interface Display
Digital Financial Graph Analysis with Data Interface
Dynamic Stock Market Data Visualization Illustration
Premium
Young Data Analyst Analyzes KPI Dashboard On Computer
Digital Financial Data Display on Dynamic Grid
Digital Stock Market Chart and Networking Interface
Colombian Stock Market Data Amid Colored Background
Digital Financial Data Processing and Analysis
Premium
Cropped unrecognizable person analyzing financial data on tablet. Generative AI image
Premium
Glowing upward arrow graph made of digital particles, symbolizing growth and success on a dark background with bokeh lights.
Financial Data Visualization with Graphs and Charts on Navy Background
Digital Graph Analytics with Currency Symbols in Virtual Background
Fluctuating Stock Market Data on Digital Screen
Dynamic Financial Data Analysis and Graphs for Market Trends
Premium
Business analytics concept with person analyzing upward financial growth on laptop using digital charts and arrows on futuristic background.
Financial Data Against Bolivia Flag with Colorful Bar and Line Graphs
Digital Projection of Financial Data with Bar Graphs
Digital Data Visualization with Abstract Statistical Insights
Premium
Businesswoman typing on laptop with digital financial chart overlay, representing data analysis, stock market trends, economic growth, investment, business strategy, and modern technology.
Futuristic Financial Data Analysis with Graphs and Charts
Financial Data Graph on Digital Screen Displaying Market Trends
FinTech Global Data Chart with Statistical Analysis
Modern Data Dashboard Display with Interactive Charts
Premium
The dynamic financial graph overlaying a vibrant urban skyline at night.
Futuristic Financial Chart on Glass Display Showing Growth Trends
Financial data dashboard showing rising bar charts and trend lines over city glass facade
Abstract Stock Market Data and Financial Graphs Visualization
Digital Financial Data with Trending Arrows
Dynamic Data Processing with Digital Interface Elements
Digital Stock Market Data Visualization on Black Background
Digital Financial Data Chart and Analytics Interface
Financial Data Screens with Global Network Analysis
Premium
Dynamic digital financial graph with glowing purple and blue trend lines on dark background displaying market analytics data for investment technology
Premium
Business professionals analyzing financial data and charts on laptop during meeting, discussing strategies and performance metrics in modern office setting
Financial Data Processing Overlaying Urban Streetscape
Premium
Financial growth indicators with positive trends showing values growth
Abstract Financial Data with Digitally Enhanced Graphs
Digital Data Visualization Over World Map in Network Concept
Futuristic Financial Data Digital Display Background
Digital Financial Analysis with Real-Time Stock Market Data
Statistical Financial Data Analysis on Digital Grid
Dynamic Stock Market Graph with Data Metrics Background
Financial Data Visualization with Futuristic Bars and Lines
Financial Data Information with Graphs and Charts for Stock Market Analysis
Financial Data Analysis with Stock Market Graphs
Financial Data Visualization with Increasing Graph Trend
Digital Data Processing with Animated Bar Graphs on Global Scale
Dynamic Digital Data Processing and Analysis Graphs
Premium
Businessman using digital banking interface on tablet with financial data analytics and futuristic holographic user interface in office background. Ai generative
Financial Data Analysis with Graphs and Charts on Dark Background
Financial Data Analytics with Interactive Graphs and Charts
Financial Data Processing with Charts and Graphics on Digital Blue Background
Binary Code Flowchart Background with Digital Animation
Dynamic Digital Charts and Financial Data Visualization
Digital Financial Chart With Dynamic Area and Line Graphs
Digital Finance Dashboard Showing Analytics and Currency Exchange
Cybersecurity Dashboard With Data and Code Elements Display
Premium
A professional analyzing financial data using a digital tablet with dynamic charts and graphs.
Futuristic Financial Charts with Virtual Arrows
Digital Financial Charting and Data Processing on Black Background
Premium
Professional analyst reviews dynamic financial data visualizations on a modern laptop, driving business growth and informed decisions.
Dynamic Stock Market Analytics with High-Tech Data Visualization
Digital Display of Financial Markets Data Analytics
Dynamic Financial Data Charts on Black Screen Visualizing Global Market Trends
Rising Financial Graphs with Digital Data Interface
Dynamic Financial Data Visualization with Stock Market Indicators
Digital Financial Data Analytics with Graphs and Codes
Futuristic Financial Data Analysis with Rising Stock Chart
Graph Showing Stock Market Activity and Financial Data Analysis
Digital Stock Market Analysis with Graphs and Charts
Dynamic Financial Data Analytics Display with Graphs
Digital Graph over Stock Market Data Concepts
Stock Market Graph and Data Analysis
Stock Market Data Visuals Analyze Global Economic Trends
Premium
Abstract representation of financial growth with glowing graphs and data patterns in dark background
Futuristic Financial Data Display with Stock Market Analysis
Dynamic Data Analytics Interface Showing Statistical Trends
Financial Data Visualization with Dynamic Graphs and Charts
Dynamic Financial Graphs and Data Fluctuations
Premium
Creative concept of financial success and investment boost, with a neon rocket launching on a bullish stock market chart background
Digital Display of Global Financial Data Process
Digital Financial Graphs and Data Analysis Visualization
Stock Market Analysis with Graphs and Trading Data
Dynamic Financial Data with Fluctuating Graph Lines
Premium
Financial data graph with rising and falling trends in vibrant colors
Premium
Retail store displaying futuristic data analytics interface
Dynamic Bar and Line Chart Representing Market Trends on Digital Screen
Futuristic Data Dashboard with Graphs and Numeric Visuals
Red Cyber Terminal Showing Teal Bar Charts and White-Red Line Graphs for Analytics
Financial Data Streaming with Arrows Over Graphic Indicators
Dynamic Data Visualization Depicting Financial Growth Trends
Dynamic Stock Market Charts with Financial Data
Data Analytics and Stock Market Trends on Digital Display
Dynamic Financial Data on Digital Display Canvas
Global Financial Data Analytics with World Map and Graphs
Digital Shield Padlock for Global Internet Security
Digital Financial Data Display with Red and Blue Highlights
Financial Data Charts Displaying Market Trends and Analytics
Dynamic Stock Market Graphics on Modern Digital Interface
Analyzing Financial Graphs with Real-Time Data Trends
Premium
Abstract futuristic technology background with glowing lines charts and data visualization
Premium
Analyzing financial charts and data reports in modern office setting
Digital Crypto Firewall Technology
Digital Data Analytics Showing Bar Graph and Curves on Black Background
Complex Financial Graphs Showing Market Changes and Data Analysis
Innovative Digital Data Chart Overlaid on Glass Building
Premium
Hand pointing at a world map with stock market charts and data overlays indicating global financial activity
Premium
Data analyzing and stock market visualization with digital charts, financial dashboards, and performance metrics. Ideal for investment analysis, trading strategy, and economic forecasting.
Dynamic Financial Data Analytics and Stock Market Trends
Innovative Digital Finance Data Display on Dark Interface
Analyzing Complex Financial Data in Digital Display
Digital Data Analysis with Stock Market Visualization
Global Financial Analytics on Digital World Map
Premium
A business professional reviews financial data on a laptop, highlighting growth through virtual graphs and modern analytics in a professional office setting. Impute
Financial Data Processing with Graphs and Charts Background
Data Analytics with Stock Market Chart Display
Dynamic Data Visualization with Interactive Charts and Graphs
Dynamic Financial Stock Market Candlestick Trend Analysis
Premium
Manager touches growth graph on analytics dashboard. Business data analysis reports with marketing finance management strategy. Digital charts graphs increase business performance, sales statistic
Neon analytics displaying clustered bar chart with cyan bars, orange accent, trend lines