- Home >
- Stock Photos >
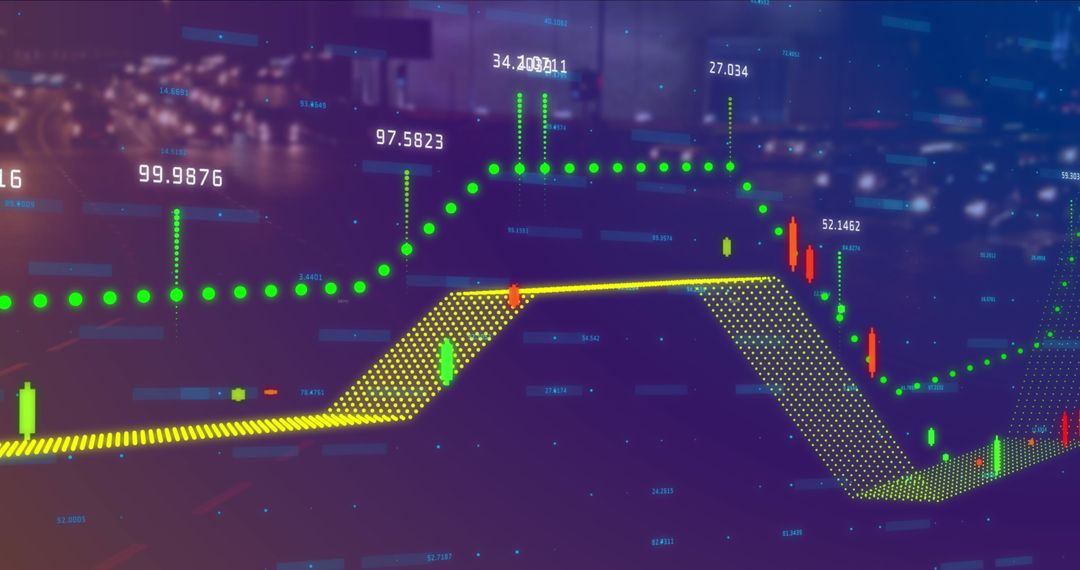
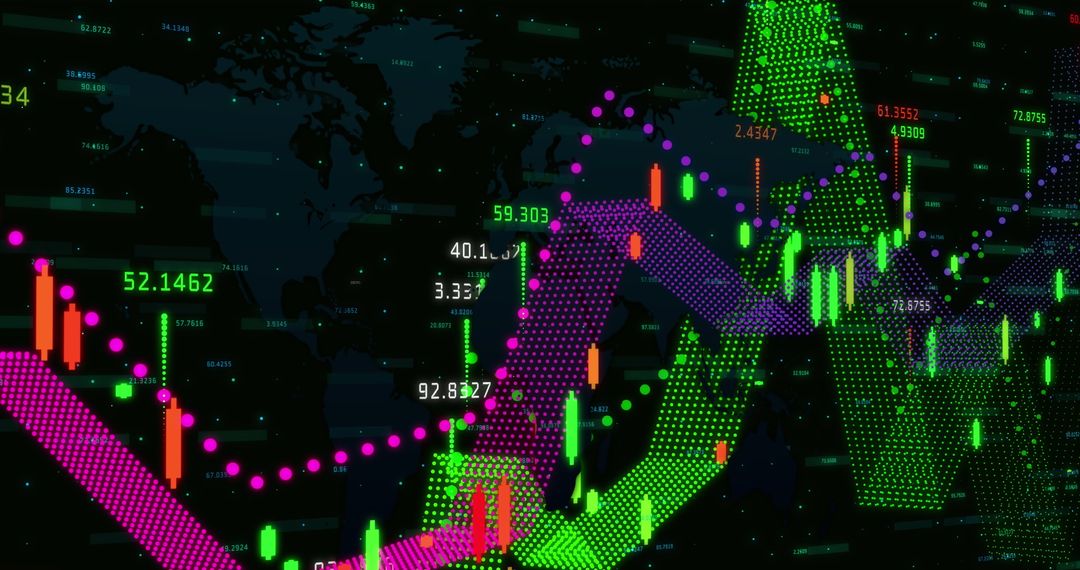
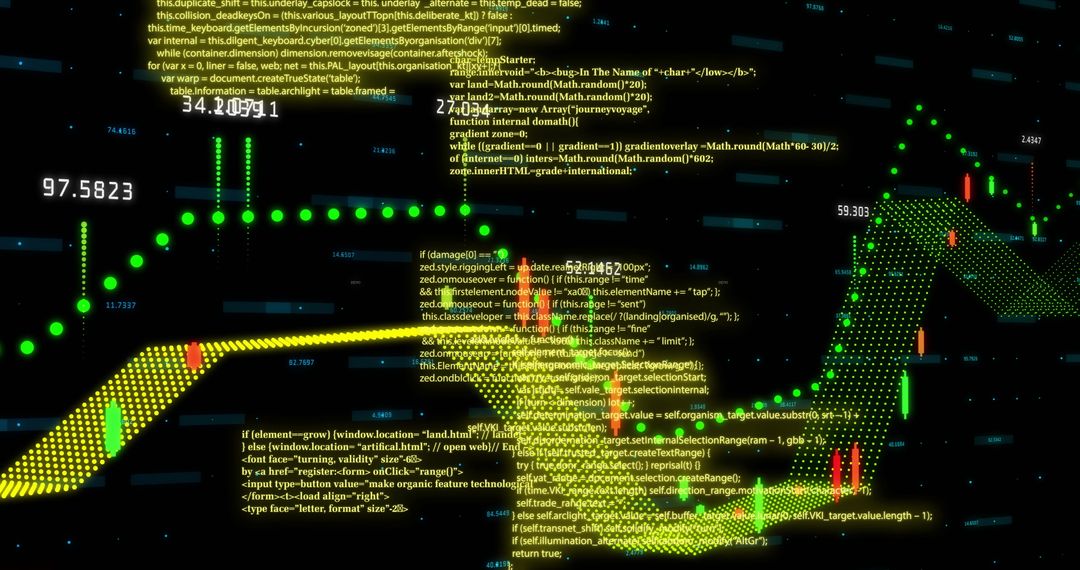
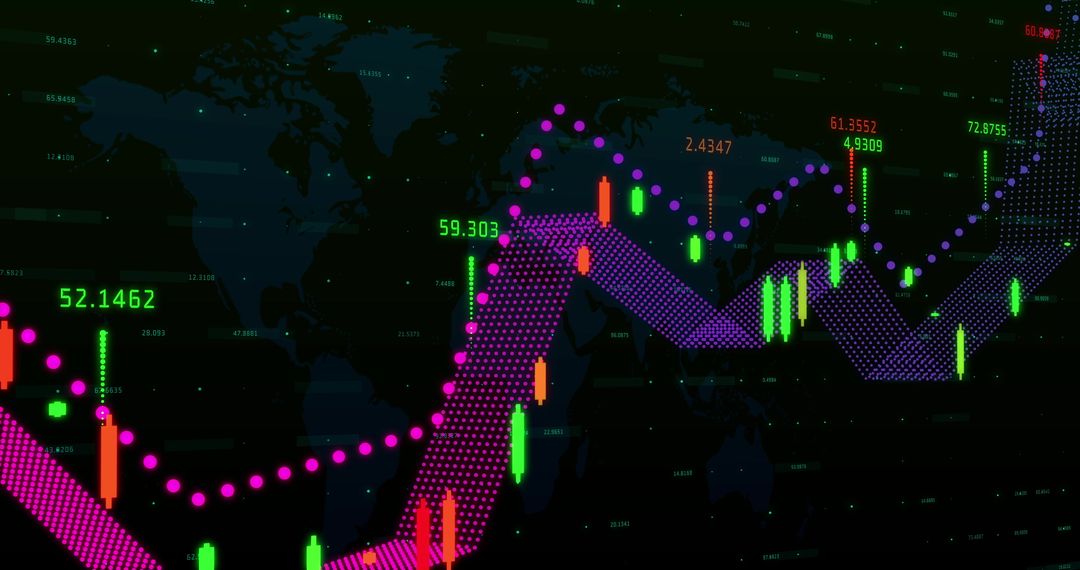
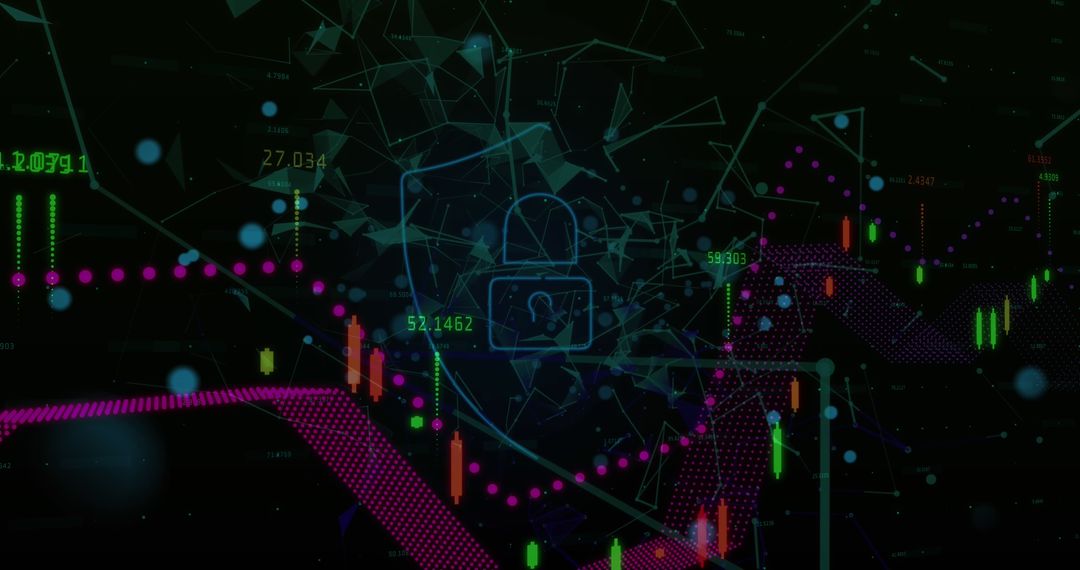
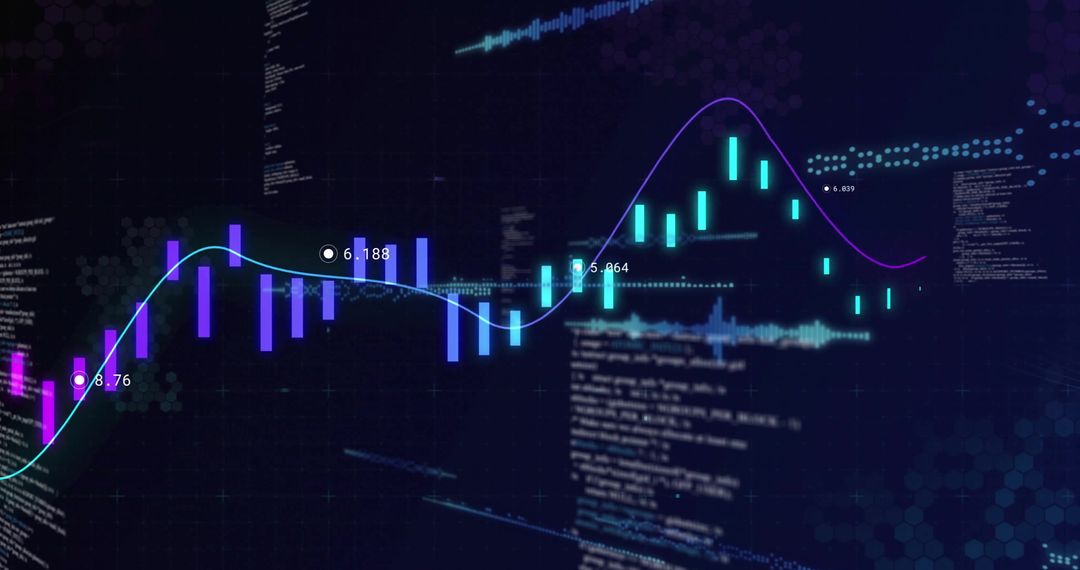
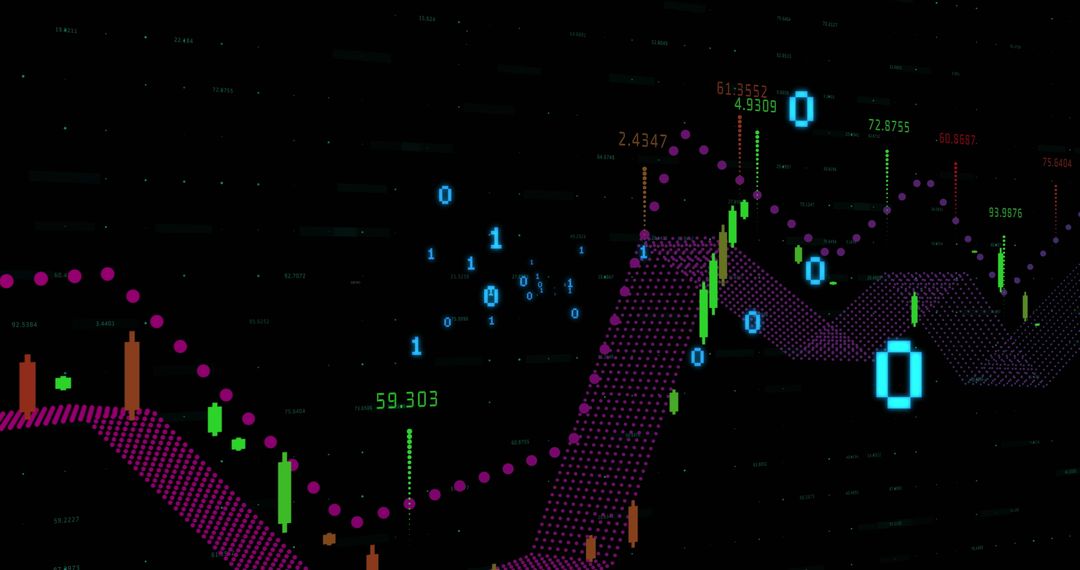
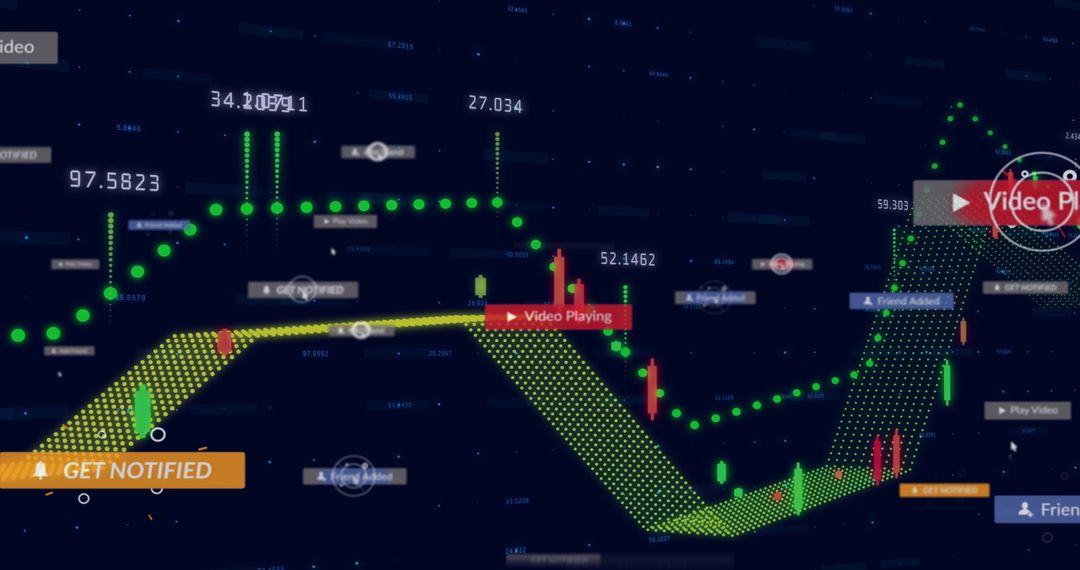
- Abstract Financial Data and Globalization Symbols Simulation
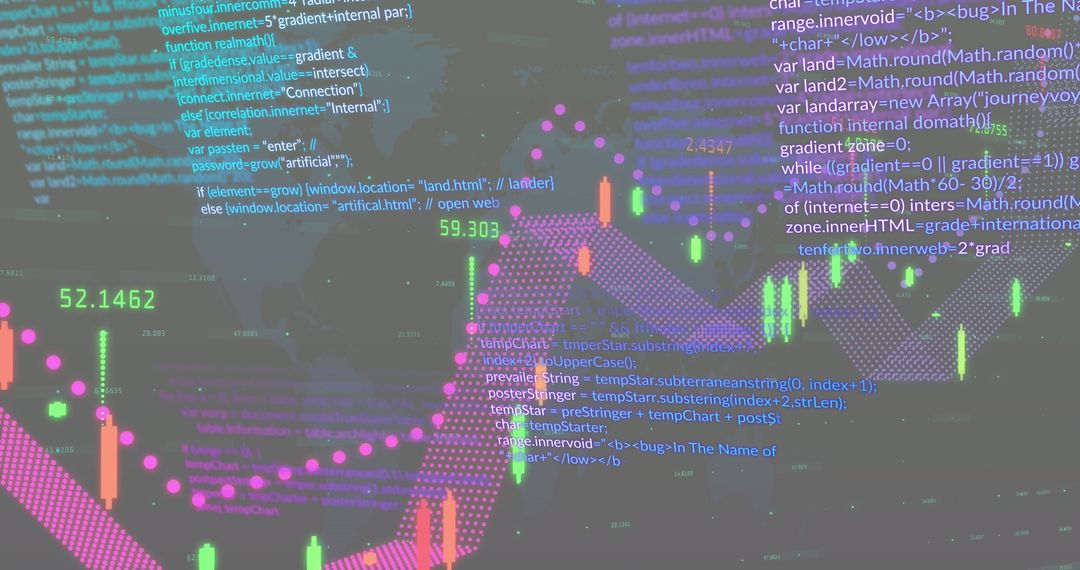
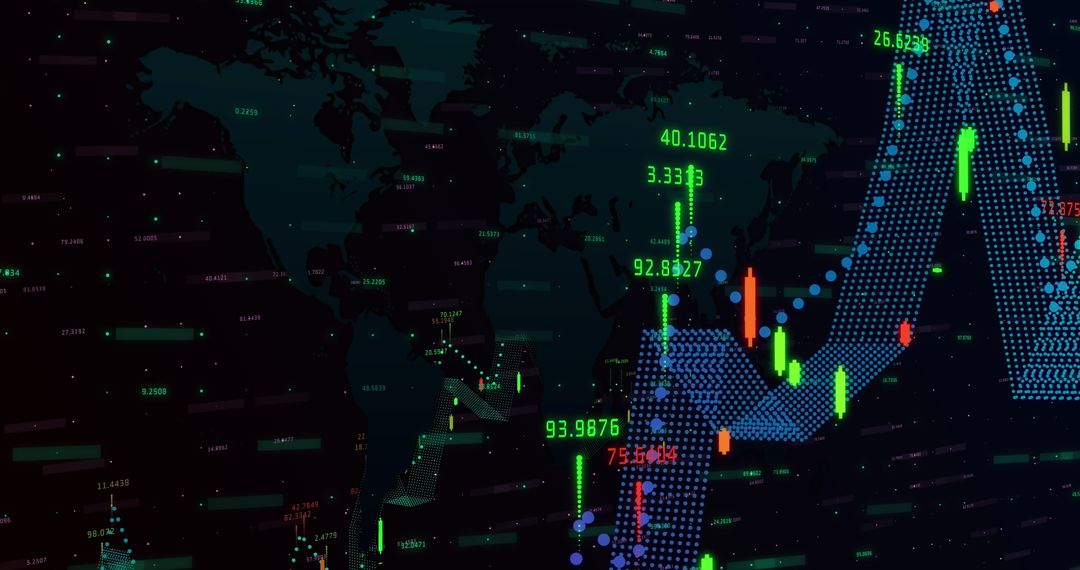
Abstract Financial Data and Globalization Symbols Simulation Image

Displaying colorful graphs, numbers, and globes against a black backdrop, showcases a blend of finance and global interconnectedness propelled by technology. Useful for illustrating financial analysis, economic trends, globalization discussions, or technological advancements, this composition implies precision and futuristic data capabilities. Perfect for business presentations, instructional materials, or tech-centered marketing visuals.
Powered by 


2
downloads
downloads
Tags:
More
Credit Photo
If you would like to credit the Photo, here are some ways you can do so
Text Link
photo Link
<span class="text-link">
<span>
<a target="_blank" href=https://pikwizard.com/photo/abstract-financial-data-and-globalization-symbols-simulation/a624679c9a80c731a7b9b1b90c0f2018/>PikWizard</a>
</span>
</span>
<span class="image-link">
<span
style="margin: 0 0 20px 0; display: inline-block; vertical-align: middle; width: 100%;"
>
<a
target="_blank"
href="https://pikwizard.com/photo/abstract-financial-data-and-globalization-symbols-simulation/a624679c9a80c731a7b9b1b90c0f2018/"
style="text-decoration: none; font-size: 10px; margin: 0;"
>
<img src="https://pikwizard.com/pw/medium/a624679c9a80c731a7b9b1b90c0f2018.jpg" style="margin: 0; width: 100%;" alt="" />
<p style="font-size: 12px; margin: 0;">PikWizard</p>
</a>
</span>
</span>
Free (free of charge)
Free for personal and commercial use.
Author: Awesome Content
Similar Free Stock Images

Premium


Premium


Premium


Premium


Premium


Premium


Premium


Premium


Premium


Premium


Premium


Premium


Premium


Premium


Premium


Premium


Premium


Premium


Premium


Premium


Premium


Premium


Premium


Premium