
- Home >
- Stock Photos >
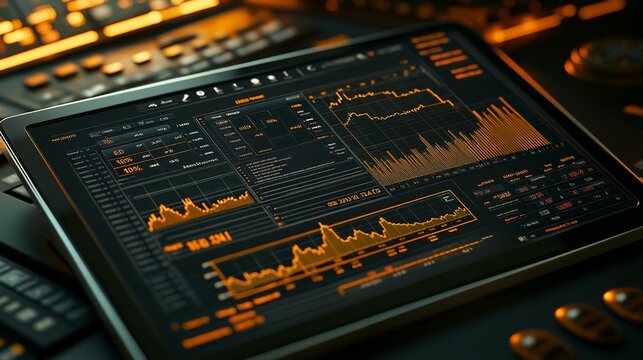
- Abstract Financial Data and Graph Analysis on Digital Screen
Abstract Financial Data and Graph Analysis on Digital Screen Image

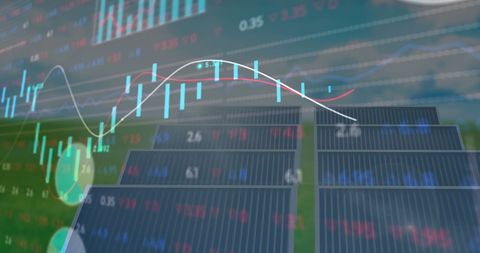
Abstract depiction of financial data visualized on a digital screen with graphs and numerical values. Lines and charts represent market trends and economic statistics, showcasing complex business computations. Ideal for use in topics related to finance, corporate analytics, technology in business, and global market studies. Suitable for illustrating modern finance information in a digital world or during presentations on economic research and analysis.
Powered by 


downloads
Tags:
More
Credit Photo
If you would like to credit the Photo, here are some ways you can do so
Text Link
photo Link
<span class="text-link">
<span>
<a target="_blank" href=https://pikwizard.com/photo/abstract-financial-data-and-graph-analysis-on-digital-screen/27f6afeaefb0f97ebddb5fa2d3122d28/>PikWizard</a>
</span>
</span>
<span class="image-link">
<span
style="margin: 0 0 20px 0; display: inline-block; vertical-align: middle; width: 100%;"
>
<a
target="_blank"
href="https://pikwizard.com/photo/abstract-financial-data-and-graph-analysis-on-digital-screen/27f6afeaefb0f97ebddb5fa2d3122d28/"
style="text-decoration: none; font-size: 10px; margin: 0;"
>
<img src="https://pikwizard.com/pw/medium/27f6afeaefb0f97ebddb5fa2d3122d28.jpg" style="margin: 0; width: 100%;" alt="" />
<p style="font-size: 12px; margin: 0;">PikWizard</p>
</a>
</span>
</span>
Free (free of charge)
Free for personal and commercial use.
Author: People Creations
Similar Free Stock Images

Premium


Premium

Premium


Premium

Premium


Premium


Premium


Premium


Premium

Premium


Premium


Premium


Premium


Premium


Premium


Premium


Premium


Premium


Premium


Premium


Premium


Premium

Premium


Premium


Premium


Explore More Free Stock Images