- Home >
- Stock Photos >
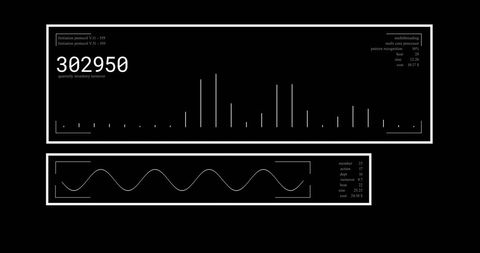
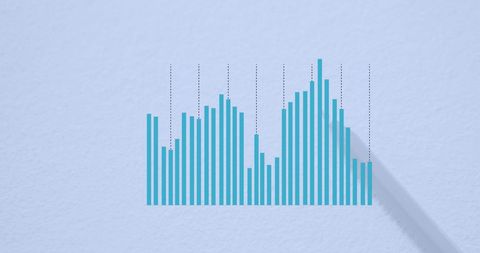
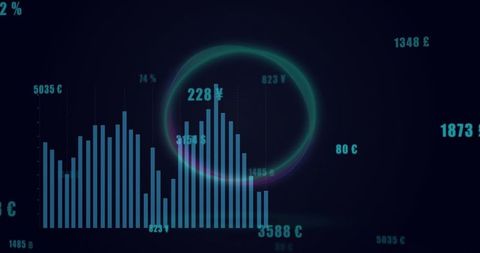
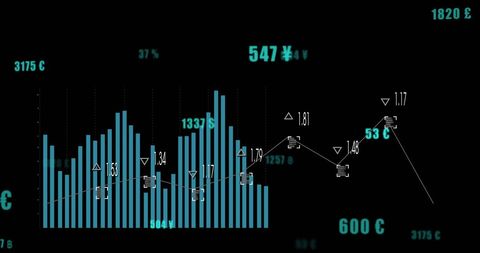
- Abstract Financial Data and Graphs on Black Background
Abstract Financial Data and Graphs on Black Background Image

Various graphs and financial data processed against a black background, reflecting global finance themes. Useful for illustrating articles on financial analysis, economic trends, investment strategy, market research studies, or digital currency forecasting.

downloads
Tags:
More
Credit Photo
If you would like to credit the Photo, here are some ways you can do so
Text Link
photo Link
<span class="text-link">
<span>
<a target="_blank" href=https://pikwizard.com/photo/abstract-financial-data-and-graphs-on-black-background/d8a3e77cd37c821e0bd1720fb48c38dc/>PikWizard</a>
</span>
</span>
<span class="image-link">
<span
style="margin: 0 0 20px 0; display: inline-block; vertical-align: middle; width: 100%;"
>
<a
target="_blank"
href="https://pikwizard.com/photo/abstract-financial-data-and-graphs-on-black-background/d8a3e77cd37c821e0bd1720fb48c38dc/"
style="text-decoration: none; font-size: 10px; margin: 0;"
>
<img src="https://pikwizard.com/pw/medium/d8a3e77cd37c821e0bd1720fb48c38dc.jpg" style="margin: 0; width: 100%;" alt="" />
<p style="font-size: 12px; margin: 0;">PikWizard</p>
</a>
</span>
</span>
Free (free of charge)
Free for personal and commercial use.
Author: Creative Art