- Home >
- Stock Photos >
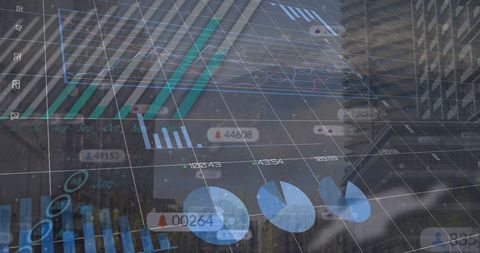
- Abstract Financial Data and Graphs on Dark Background
Abstract Financial Data and Graphs on Dark Background Image

This abstract illustration features graphic representations of financial data, including a variety of graphs and charts presented on a dark background. The fusion of digital elements with financial iconography highlights the theme of global business and finance. This image can be effectively used for presentations, financial reports, websites, educational materials, or promotional content related to economics, data analysis, or digital business innovation.

downloads
Tags:
More
Credit Photo
If you would like to credit the Photo, here are some ways you can do so
Text Link
photo Link
<span class="text-link">
<span>
<a target="_blank" href=https://pikwizard.com/photo/abstract-financial-data-and-graphs-on-dark-background/4f77b2cd74d044fdb6f467ca2703a9e7/>PikWizard</a>
</span>
</span>
<span class="image-link">
<span
style="margin: 0 0 20px 0; display: inline-block; vertical-align: middle; width: 100%;"
>
<a
target="_blank"
href="https://pikwizard.com/photo/abstract-financial-data-and-graphs-on-dark-background/4f77b2cd74d044fdb6f467ca2703a9e7/"
style="text-decoration: none; font-size: 10px; margin: 0;"
>
<img src="https://pikwizard.com/pw/medium/4f77b2cd74d044fdb6f467ca2703a9e7.jpg" style="margin: 0; width: 100%;" alt="" />
<p style="font-size: 12px; margin: 0;">PikWizard</p>
</a>
</span>
</span>
Free (free of charge)
Free for personal and commercial use.
Author: People Creations