
- Home >
- Stock Photos >
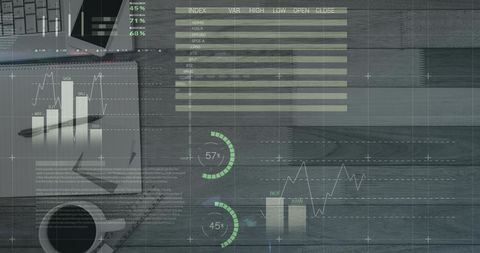
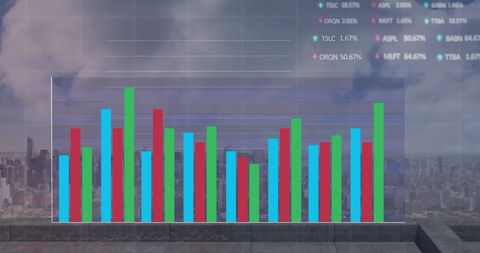
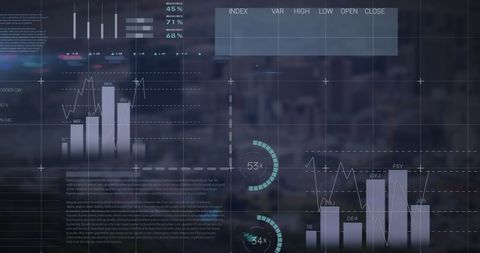
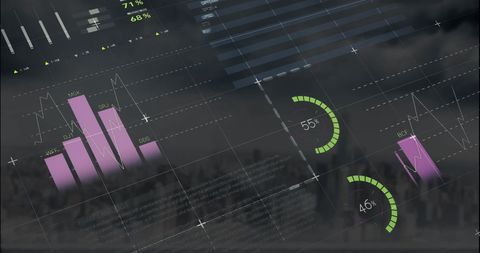
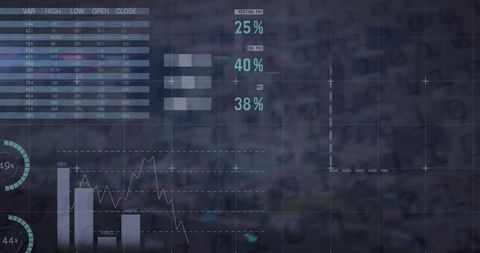
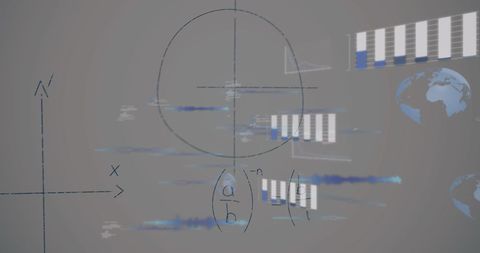
- Abstract Financial Data and Graphs on Light Background
Abstract Financial Data and Graphs on Light Background Image

Stylized depiction of financial data processing with various graphs. Visualizing complex data interactions and digital analysis, ideal for use in articles about global finance, technology innovation, or analytical software solutions.
Powered by  - Get 15% off with code: PIKWIZARD15


downloads
Tags:
More
Credit Photo
If you would like to credit the Photo, here are some ways you can do so
Text Link
photo Link
<span class="text-link">
<span>
<a target="_blank" href=https://pikwizard.com/photo/abstract-financial-data-and-graphs-on-light-background/d4f5a5e65e0065cc68a86dca6bd539d4/>PikWizard</a>
</span>
</span>
<span class="image-link">
<span
style="margin: 0 0 20px 0; display: inline-block; vertical-align: middle; width: 100%;"
>
<a
target="_blank"
href="https://pikwizard.com/photo/abstract-financial-data-and-graphs-on-light-background/d4f5a5e65e0065cc68a86dca6bd539d4/"
style="text-decoration: none; font-size: 10px; margin: 0;"
>
<img src="https://pikwizard.com/pw/medium/d4f5a5e65e0065cc68a86dca6bd539d4.jpg" style="margin: 0; width: 100%;" alt="" />
<p style="font-size: 12px; margin: 0;">PikWizard</p>
</a>
</span>
</span>
Free (free of charge)
Free for personal and commercial use.
Author: Creative Art
Similar Free Stock Images

Premium


Premium


Premium


Premium


Premium


Premium


Premium


Premium


Premium


Premium


Premium


Premium

Premium


Premium


Premium

Premium


Premium


Premium


Premium


Premium


Premium


Premium

Premium

Premium

Premium


Explore More Free Stock Images