
- Home >
- Stock Photos >
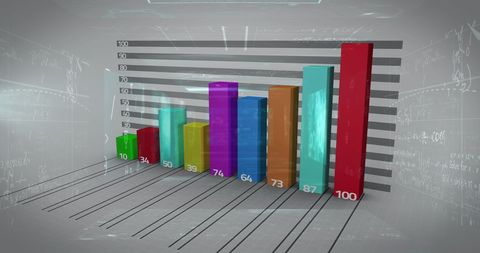
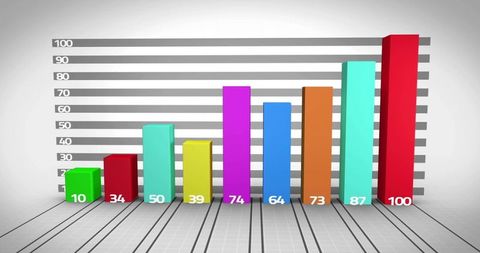
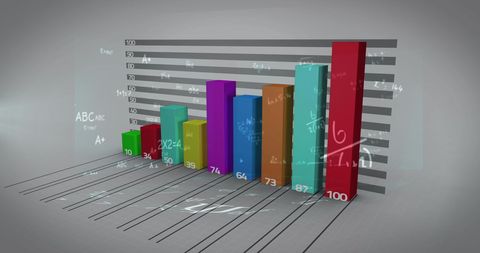
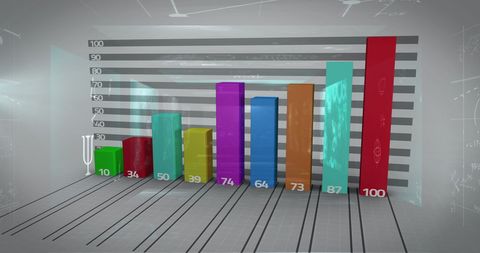
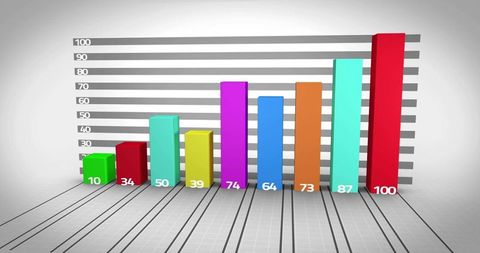
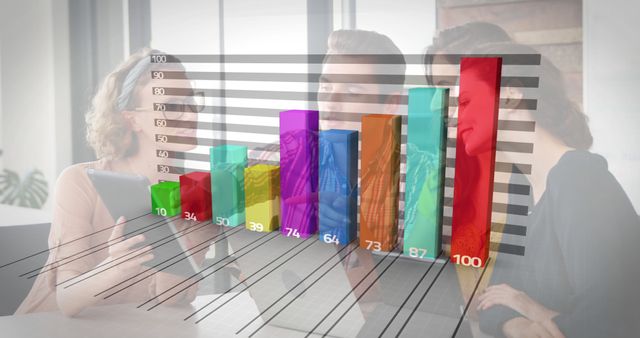
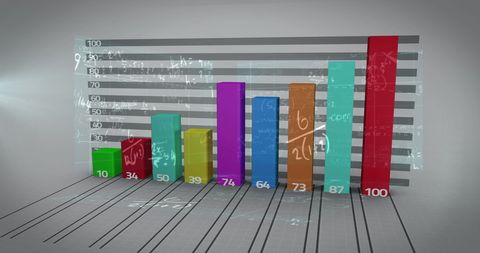
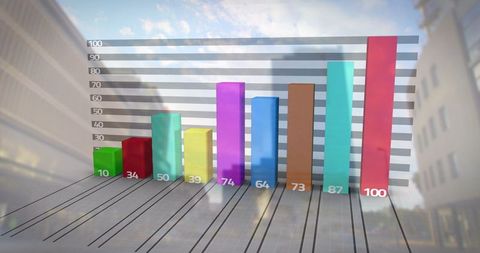
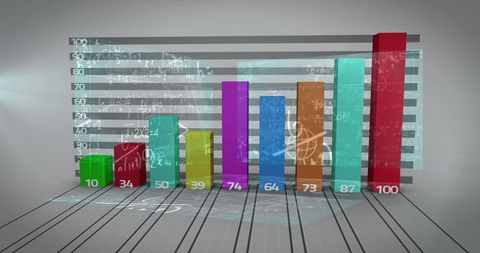
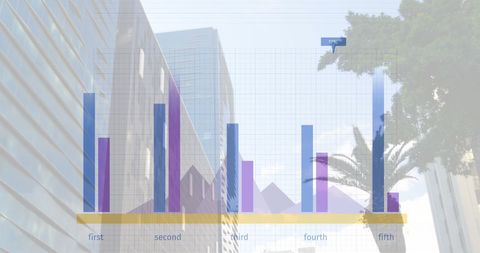
- Abstract Financial Data and Statistics Visualization with Graphical Elements
Abstract Financial Data and Statistics Visualization with Graphical Elements Image

Digitally generated abstract visualization showcasing various financial statistics in shades of purple. Ideal for presentations in finance, data analytics, and global business context. Suitable for use in corporate materials emphasizing data-driven strategies or economic trends.
Powered by  - Get 15% off with code: PIKWIZARD15


downloads
Tags:
More
Credit Photo
If you would like to credit the Photo, here are some ways you can do so
Text Link
photo Link
<span class="text-link">
<span>
<a target="_blank" href=https://pikwizard.com/photo/abstract-financial-data-and-statistics-visualization-with-graphical-elements/7e6b6cef43bbdc78b637bda4e98d9d34/>PikWizard</a>
</span>
</span>
<span class="image-link">
<span
style="margin: 0 0 20px 0; display: inline-block; vertical-align: middle; width: 100%;"
>
<a
target="_blank"
href="https://pikwizard.com/photo/abstract-financial-data-and-statistics-visualization-with-graphical-elements/7e6b6cef43bbdc78b637bda4e98d9d34/"
style="text-decoration: none; font-size: 10px; margin: 0;"
>
<img src="https://pikwizard.com/pw/medium/7e6b6cef43bbdc78b637bda4e98d9d34.jpg" style="margin: 0; width: 100%;" alt="" />
<p style="font-size: 12px; margin: 0;">PikWizard</p>
</a>
</span>
</span>
Free (free of charge)
Free for personal and commercial use.
Author: People Creations
Similar Free Stock Images

Premium


Premium


Premium

AI


AI

Premium

AI


Premium


Premium


Premium


Premium


AI

Premium


Premium


AI


Premium


Premium


Premium


Premium

Premium


Premium

Premium

Premium


Premium

Premium


Premium


Premium

Premium


Premium


Premium


AI

Explore More Free Stock Images