
- Home >
- Stock Photos >
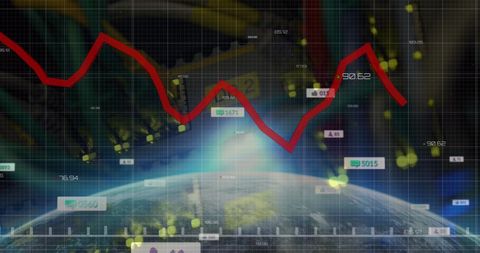
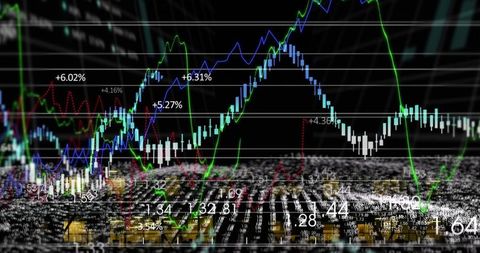
- Abstract Financial Data and Trends Analysis
Abstract Financial Data and Trends Analysis Image

Intriguing representation of financial and statistical data integrated with digital elements over black background, ideal for use in industries focused on global finance, stock market analysis, investment firms, and economic reports to illustrate data analysis methods, technical analysis, and trading strategies.
Powered by 


downloads
Tags:
More
Credit Photo
If you would like to credit the Photo, here are some ways you can do so
Text Link
photo Link
<span class="text-link">
<span>
<a target="_blank" href=https://pikwizard.com/photo/abstract-financial-data-and-trends-analysis/476e6ff801583c1ef44555e2bf9727d4/>PikWizard</a>
</span>
</span>
<span class="image-link">
<span
style="margin: 0 0 20px 0; display: inline-block; vertical-align: middle; width: 100%;"
>
<a
target="_blank"
href="https://pikwizard.com/photo/abstract-financial-data-and-trends-analysis/476e6ff801583c1ef44555e2bf9727d4/"
style="text-decoration: none; font-size: 10px; margin: 0;"
>
<img src="https://pikwizard.com/pw/medium/476e6ff801583c1ef44555e2bf9727d4.jpg" style="margin: 0; width: 100%;" alt="" />
<p style="font-size: 12px; margin: 0;">PikWizard</p>
</a>
</span>
</span>
Free (free of charge)
Free for personal and commercial use.
Author: Awesome Content
Similar Free Stock Images

Premium


Premium

Premium


Premium


Premium


Premium


Premium


Premium


Premium


Premium


Premium


Premium


Premium


Premium


Premium


Premium


Premium


Premium


Premium

Premium

Premium


Premium

Premium


Premium


Premium


Explore More Free Stock Images