1. Home > 
  2. Stock Photos > 
  3. Abstract Financial Data Chart Background with Graphs

Abstract Financial Data Chart Background with Graphs Image

Abstract Financial Data Chart Background with Graphs

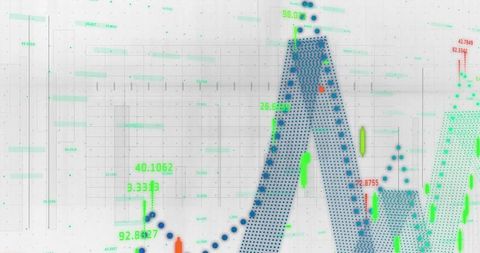
This digital illustration shows an abstract financial data chart with lines and graphs overlaid on a grey background. Ideal for use in business presentations, finance-related websites, economic analysis reports, or educational content about market trends and investment strategies.

Powered by Shutterstock logo - Get 15% off with code: PIKWIZARD15
business documents on office table with smart phone and laptop computer and graph financial with social network diagram and three colleagues discussing data in the background - Powered by Shutterstock - Get 15% off with code: PIKWIZARD15Data science and big data technology. Scientist computing, analysing and visualizing complex data set on computer. Data mining, artificial intelligence, machine learning, business analytics. - Powered by Shutterstock - Get 15% off with code: PIKWIZARD15Business team working together on a project, discussing strategy and analyzing financial data in a modern office - Powered by Shutterstock - Get 15% off with code: PIKWIZARD15Two diverse crypto traders brokers stock exchange market investors discussing trading charts research reports growth using pc computer looking at screen analyzing invest strategy, financial risks. - Powered by Shutterstock - Get 15% off with code: PIKWIZARD15Business analytics with charts, Business people use computers to analyze business and manage corporate data in office, Financial and marketing strategy, KPIs to improve organizational performance.  - Powered by Shutterstock - Get 15% off with code: PIKWIZARD15

Credit Photo

If you would like to credit the Photo, here are some ways you can do so

Free (free of charge)

Free for personal and commercial use.

Author: People Creations

Similar Free Stock Images

Loading...
Glowing Financial Data Chart on Digital Grid Background
Premium
Conference Business Meeting Presentation: CEO Businessman Shows Data to Group of Investors, Businessspeople. Projector Screen Shows Graphs, Product Sales, Revenue Growth Strategy, e-Commerce Analysis
Abstract Financial Graph On Black Background Representing Data Analysis
Premium
Analyst woman working with information database to analyze marketing and sales data. Business analytics dashboard with charts, metrics, and KPIs concept.
Premium
businessman working data document graph chart report marketing research development  planning management strategy analysis financial accounting. Business  office concept.
Digital Financial Data Visualization with Graph and Metrics
Digital Data Analytics Overlay on Cityscape
Neon Infinity with Digital Stock Market Graphics
Premium
Businessman analyzing a business analytics (BA) or intelligence (BI) dashboard on virtual screen showing sales and operations data statistics charts and key performance indicators (KPI)
Premium
Businessman using KPI dashboard.Financial business KPI System data analytics graph dashboard.Data System KPI and metrics connected in database for follow earnings,operations and sales data.
Statistical Data Processing with Graph Overlay on Buildings
Dynamic Financial Data Analysis with Illuminated Graphs
Dynamic Stock Market Graph Displaying Surging Growth
Digital Data Trends Over High-Tech Server Room
Premium
Professional analyzing financial data graphs, charts on laptop display at a modern workspace. Financial analysis or business evaluation concept
Premium
Analyst working with Financial Report and Business Analytics Dashboard on laptop computer to analyze Financial Data with KPI and Metrics. Investment, Operations, Sales, Corporate Finance, Strategy.
Premium
Businessman analyzing forex trading graph financial data. Stock Market Investments Funds and Digital Assets. Business finance technology and investment concept. Business finance background.
Abstract Digital Financial Data Display with Graph Overlay
Digital Data Processing with Neon Grid Overlay
Abstract Digital Charts with Social Media Metrics Rising
Digital Graph with Rising and Falling Lines on Grid Background
Abstract Data Processing and Digital Analysis
Financial Data Processing with Modern Cityscape Background
Financial Growth Curve Over City Skyline Displaying Business Trends
Premium
Two men are sitting at a desk with a white board and a stack of papers. One of the men is pointing at the white board while the other man looks on. The white board has a few numbers and graphs on it
Premium
Stockmarket online trading chart candlestick on crypto currency platform. Stock exchange financial market price candles graph data pattern analysis concept. Computer screen closeup background
Premium
Data analysis, business meeting or woman with graph presentation in office for revenue, profit or sale statistics. Chart, analytics or accounting mentor brainstorming economy, inflation or solution
Modern Data Analyzing Dashboard with 3D Chart Visualization
Financial Charts and Graphs Over Urban Cityscape
Financial Growth Illustrated with Bar Charts and Upward Arrow
Dynamic Financial Data Display in Digital Space
Financial Data Analysis with Global Digital Interface
Digital Financial Data Overlaying Skyline of Modern City
Dynamic Digital Data Analysis on Elevated Grid
City Skyline with Overlay of Financial Data Trends
Data Recovery Progress Display on Digital Interface
Premium
Business people analyze financial data chart trading forex, Investing in stock markets, funds and digital assets, Business finance technology and investment concept, Business finance background.
Premium
Business people analyze financial data chart trading forex, investing in stock markets, funds and digital assets, Business finance technology and investment concept, Business finance background.
Digital Financial Dashboard with Graphs and Data Visualization
Abstract Digital Chart in Futuristic Financial Analysis Concept
Financial Growth Chart Overlay on City Skyline
Optimized Statistical Data Overlain on Corporate Architecture
Futuristic Stock Market Graph With Digital Overlay
Premium
Financial Expert Reviews Market Projections and Investment Strategies on Computer
Financial Data Analytics Over Modern Cityscape
European Market Data Overlay with EU Flag and Financial Graphs
Analytics Graph Overlay on Modern Data Center
Dynamic Business Data and Cityscape Visualization
Premium
Composite collage picture of black white colors arms hold magnifier lens glass enlarge graphics paper isolated on painted background
Dynamic Financial Data Visualization on Digital Grid Background
Abstract Financial Graphs Over Modern Cityscape
Financial Data Processing Over Computer Servers
Analyzing Financial Data with Business Charts Against Urban Skyline
Premium
Close up back view of businessman work on computer and cellphone consider financial diagrams graphs. Male CEO or employee analyze finances statistics on laptop and smartphone. Banking concept.
Dynamic Financial Graphs Overlaying Urban Skyline
Glowing Data Graph Over Cityscape with Cloudy Sky
Financial Growth Stock Nikkei in Urban City Skyline
Abstract Digital Data Visualization with Line Graph on Purple Background
Premium
Male coach hold seminar for staff, makes presentation, provides sales statistics explanation gathered in modern conference room, with monitor screen with infographic charts, graphs and diagrams data
Interactive Digital Infographic with Callouts and Graph Elements
Visualizing market volatility on navy gradient with magenta and blue trend lines, copy space
Digital Finance Data Overlaying Futuristic Cityscape
Digital Financial Data Overlaying City Skyline at Dusk
Premium
Abstract glowing big data forex candlestick chart on blurry city backdrop. Trade, technology, investment and analysis concept. Double exposure
Digital Interface with Virtual Data Surging Across Connection Globes
Financial Data Flow against Urban Skyline Backdrop
Rising Stock Market Graph on Blue Financial Background
Dynamic Financial Growth Representing Business Trends
Neon Infinity over Digital Finance Graph
Neon Infinity Symbol Over Financial Graph on Digital Screen
Abstract Financial Charts with Graphs and Data Visualization
Financial Data Statistics Visualized in Urban Setting
Digital Financial Data with Graph and Grid Patterns
Premium
Business finance technology and investment concept, Business finance background.Business people analyze financial data chart trading forex, Investing in stock markets, funds and digital assets.
Server Network Analytics with Data Visualization Overlay
Digital Interface Display Over Urban Skyline for Financial Analytics
Dynamic Financial Growth Digital Chart Display
Data Analytics Graphs on Digital Interface Background
Abstract Financial Growth Visualization with City Background
Financial Graphs Overlaying Shopping Bag Representation Economy
Financial Graphs Overlaying Industrial Junkyard
City Skyline with Overlay of Financial Market Trends
Digital Financial Data and AI Illustration Networking Globally
Cloud Data Visualization and Analytics Design
Abstract Data Processing over Cityscape with Blue and Red Lines
Abstract Graphs Over Modern Building at Night
Tech Growth Analysis with Dynamic Data Visualization
Digital Graph Animation Over Cityscape Reflecting Network Connectivity
Financial Growth Statistic Data Processing Over Urban Cityscape
Abstract Data Visualization with Technological Grid Background
City Skyline with Overlaid Transparent Business Line Graph
Premium
Stock market or forex trading graph on touchscreen,  finance and investment concept. Economy trends for business, financial charts and digits.
Realtime Trading Dashboard Showing Green Candlestick Chart with Technical Indicators and Volume
Financial Data Visualization Over Futuristic Cityscape
Abstract Financial Data and Global Business Interface
Abstract Digital Data Network with Graphs and Symbols
Neon Statistical Data Over Cityscape Reflecting Technology Trends
Financial Data Graph Rendering Global Market Trends
Futuristic Digital Data Analytics Interface Display
Digital Graph Interface with Glowing Data and Readings
Financial Graph and Waves Representing Market Trends and Data
Neon Infinity Symbol Overlay on Digital Finance Interface
Abstract Financial Chart Background with Bar and Line Graphs
Financial Data Analysis in Modern Server Room Environment
Premium
Business hierarchy structure. 
Relations of order or subordination between members. Business process and workflow automation with flowchart. Virtual screen Mindmap or Organigram.
Rising Digital Graph Overlay on City Skyline at Dusk
Dynamic Stock Market Graphs and Financial Data
Dynamic Glowing Digital Graphs on 3D Grid Background
Financial Graph Displayed Over City Skyline at Sunset
Gamepad Icon Overlaid on Financial Data Chart
Dynamic Financial Data Visualizations on Grid Interface
Digital Connections Over Cityscape with Graph Overlay
Futuristic Data Visualization with Neon Graphic Elements
Premium
Financial advisor explaining invest stock market data consulting investor. Two busy business men analysts doing finance trading analysis pointing at exchange chart on laptop screen working in office.
Premium
African American woman analyzing financial data on laptop screen in hybrid office setting for digital entrepreneurship KPI dashboard.
Premium
Business strategy development and growing growth plan.	
Financial management strategy for business growth.Graph and chart. Investment of growth on currency rate.
Abstract Financial Data Trends Overlaying Cityscape
Interactive Social Media Metrics Overlaid on Business Data Graph
Digital Financial Chart Overlay on Modern City Skyline
Futuristic Data Graph Overlay on City Skyline
Financial Data Analysis Overlaying Urban Cityscape Background
Digital Financial Growth Analysis with Bars and Line Charts
Futuristic 3D Finance Dashboard with Neon Waveform and Candlesticks
Financial Dashboard with Line and Bar Graphs for Market Analysis
Premium
Businesswomen use magnifier glass find stock in stock markets, uptrends, growth economics, business strategy development, and opportunities for investment, take profit from funds, Financial Analyst.