
- Home >
- Stock Photos >
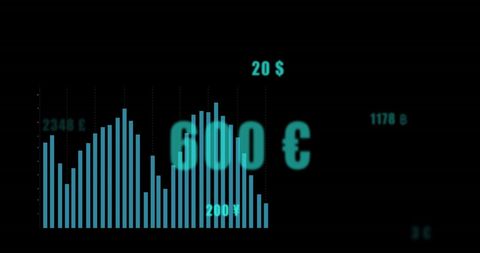
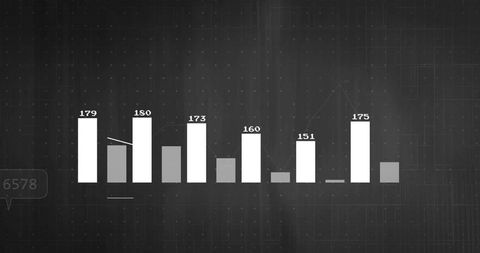
- Abstract Financial Data Chart on Clean White Background
Abstract Financial Data Chart on Clean White Background Image

This image displays abstract financial data charts on a white background, ideal for business presentations, educational materials, and financial reports. It visually communicates analysis and connections inherent in the global economic system, making it a great tool for conveying data-driven insights.
Powered by  - Get 15% off with code: PIKWIZARD15


downloads
Tags:
More
Credit Photo
If you would like to credit the Photo, here are some ways you can do so
Text Link
photo Link
<span class="text-link">
<span>
<a target="_blank" href=https://pikwizard.com/photo/abstract-financial-data-chart-on-clean-white-background/4f6a024884584aa3ba6437ca50c22bd5/>PikWizard</a>
</span>
</span>
<span class="image-link">
<span
style="margin: 0 0 20px 0; display: inline-block; vertical-align: middle; width: 100%;"
>
<a
target="_blank"
href="https://pikwizard.com/photo/abstract-financial-data-chart-on-clean-white-background/4f6a024884584aa3ba6437ca50c22bd5/"
style="text-decoration: none; font-size: 10px; margin: 0;"
>
<img src="https://pikwizard.com/pw/medium/4f6a024884584aa3ba6437ca50c22bd5.jpg" style="margin: 0; width: 100%;" alt="" />
<p style="font-size: 12px; margin: 0;">PikWizard</p>
</a>
</span>
</span>
Free (free of charge)
Free for personal and commercial use.
Author: Awesome Content
Similar Free Stock Images

Premium


Premium


Premium

Premium


Premium


Premium


Premium


Premium


Premium


Premium


Premium

Premium


Premium

Premium

Premium


Premium


Premium

Premium


Premium


Premium


Premium

Premium


Premium


Premium


Premium


Explore More Free Stock Images