
- Home >
- Stock Photos >
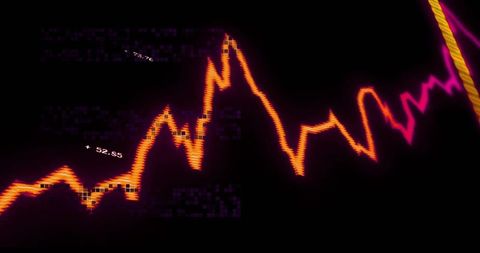
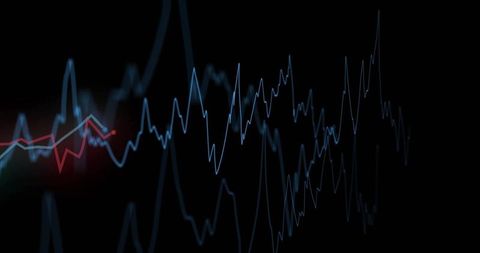
- Abstract Financial Data Chart on Dark Background
Abstract Financial Data Chart on Dark Background Image

Shows vibrant financial graphs on black background, symbolizing global trading and data processing. Ideal for articles on finance, economic analysis, digital marketing, or technology.
Powered by 


downloads
Tags:
More
Credit Photo
If you would like to credit the Photo, here are some ways you can do so
Text Link
photo Link
<span class="text-link">
<span>
<a target="_blank" href=https://pikwizard.com/photo/abstract-financial-data-chart-on-dark-background/ea5dfa7b346021d72f4e8f57f02c9738/>PikWizard</a>
</span>
</span>
<span class="image-link">
<span
style="margin: 0 0 20px 0; display: inline-block; vertical-align: middle; width: 100%;"
>
<a
target="_blank"
href="https://pikwizard.com/photo/abstract-financial-data-chart-on-dark-background/ea5dfa7b346021d72f4e8f57f02c9738/"
style="text-decoration: none; font-size: 10px; margin: 0;"
>
<img src="https://pikwizard.com/pw/medium/ea5dfa7b346021d72f4e8f57f02c9738.jpg" style="margin: 0; width: 100%;" alt="" />
<p style="font-size: 12px; margin: 0;">PikWizard</p>
</a>
</span>
</span>
Free (free of charge)
Free for personal and commercial use.
Author: Authentic Images
Similar Free Stock Images

Premium


Premium


Premium


Premium


Premium


Premium


Premium


Premium

Premium


Premium


Premium


Premium


Premium

Premium


Premium


Premium


Premium


Premium


Premium

Premium

Premium


Premium


Premium

Premium


Premium


Explore More Free Stock Images