- Home >
- Stock Photos >
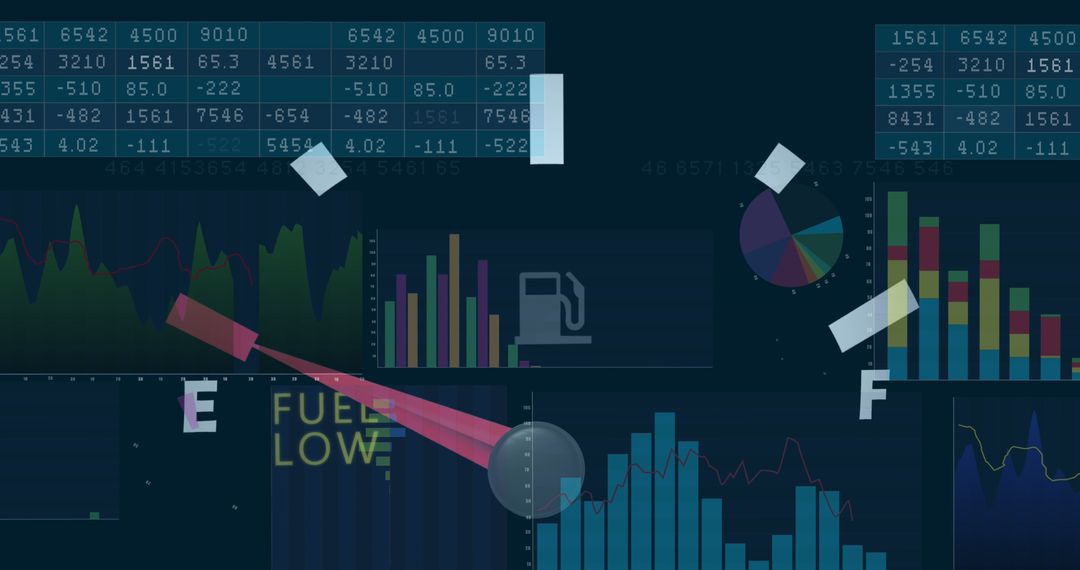
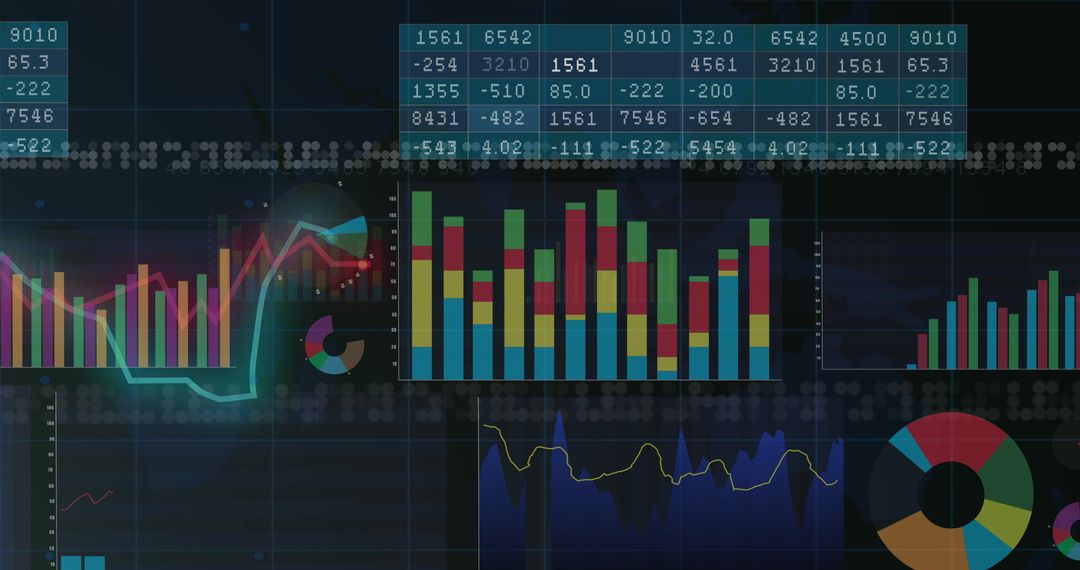
- Abstract Financial Data Charts and Graphs on Black Background
Abstract Financial Data Charts and Graphs on Black Background Image

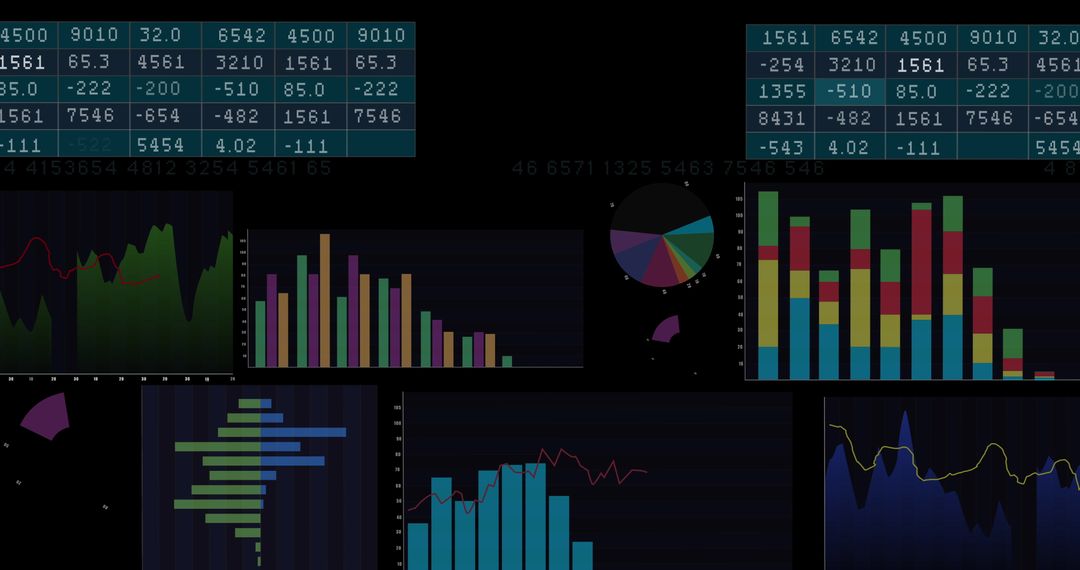
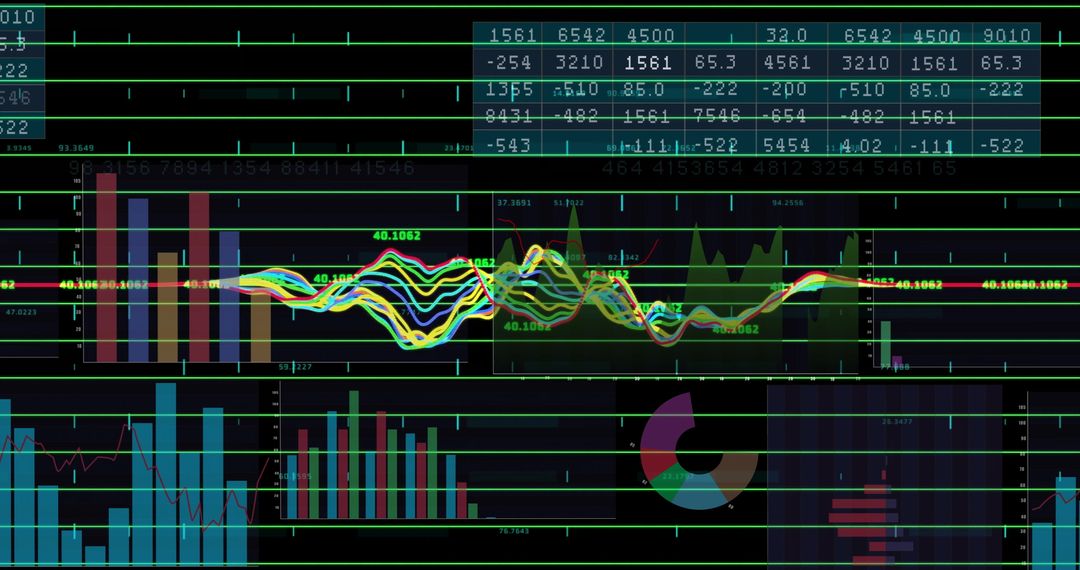
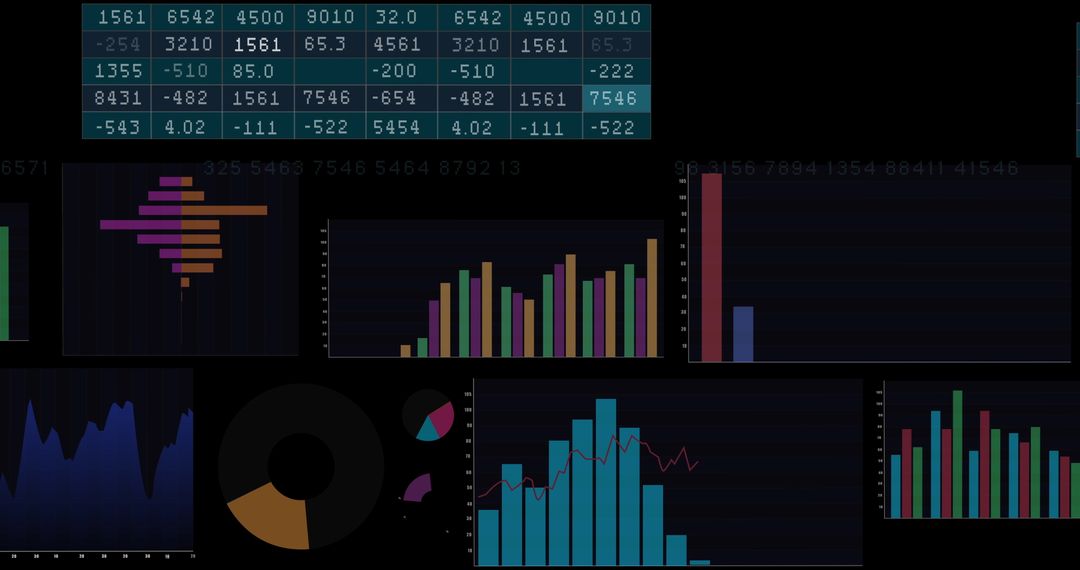
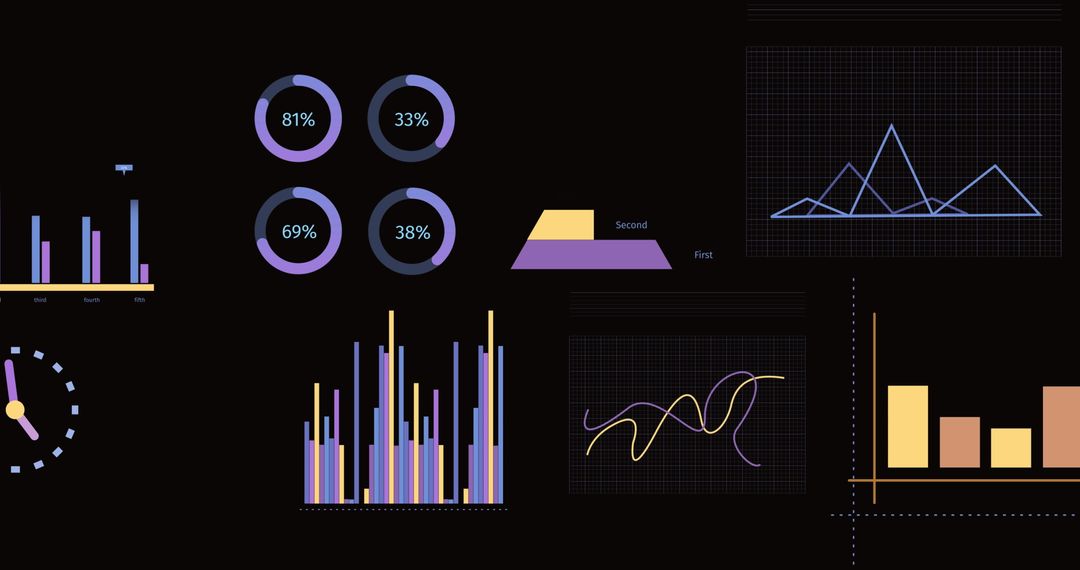
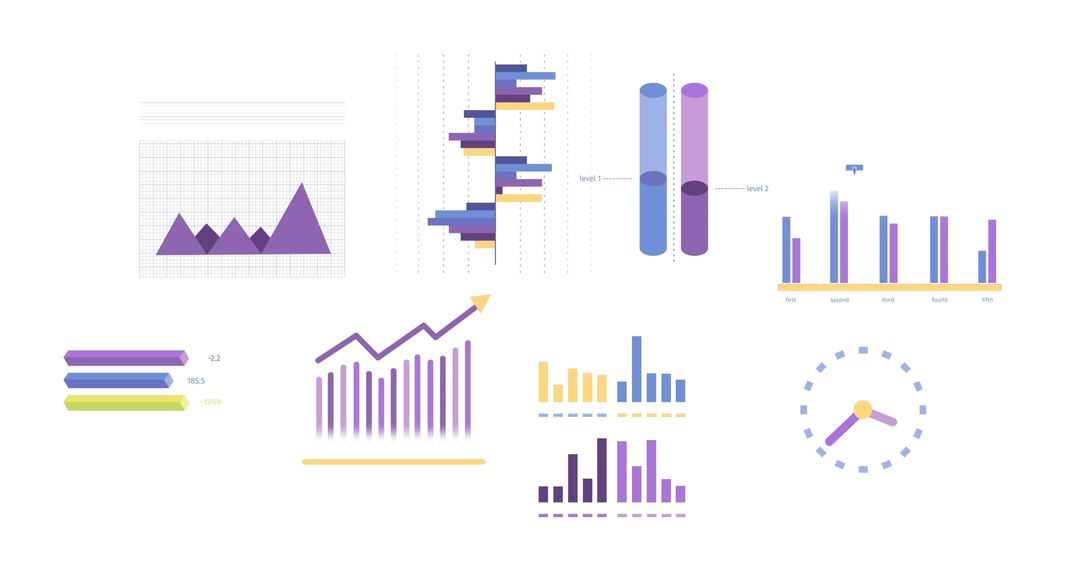
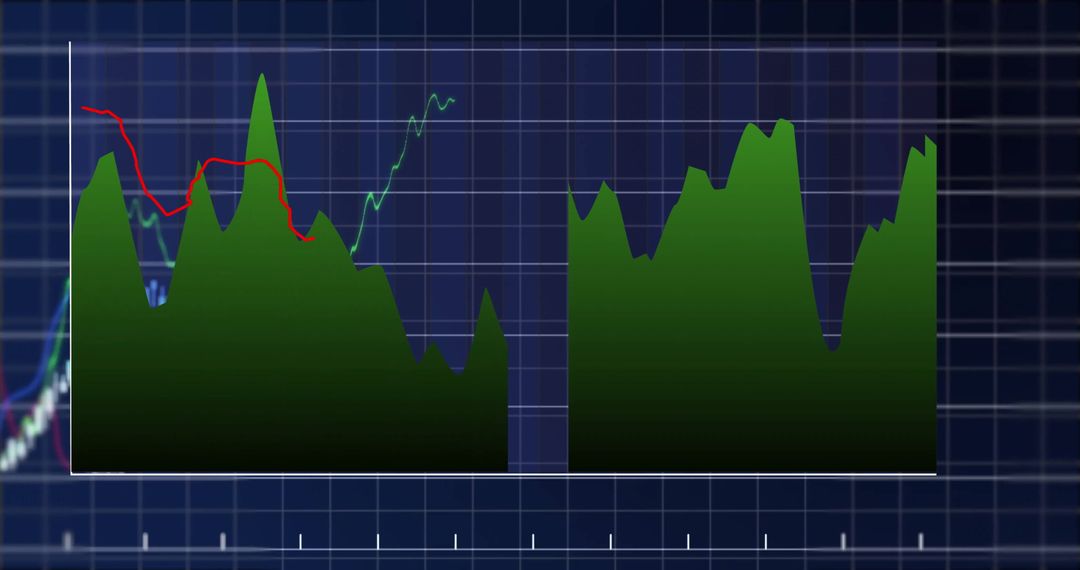
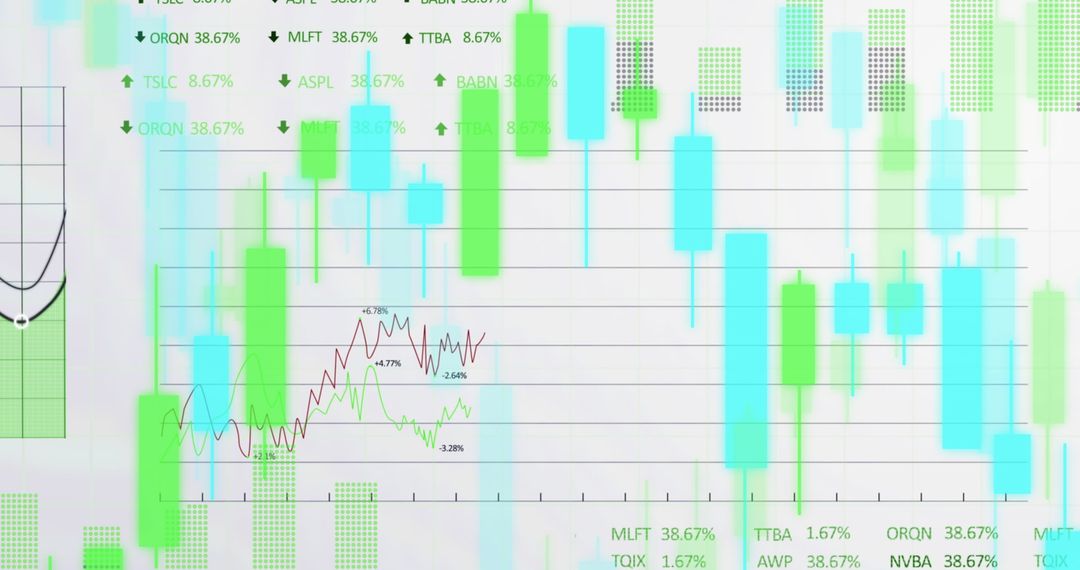
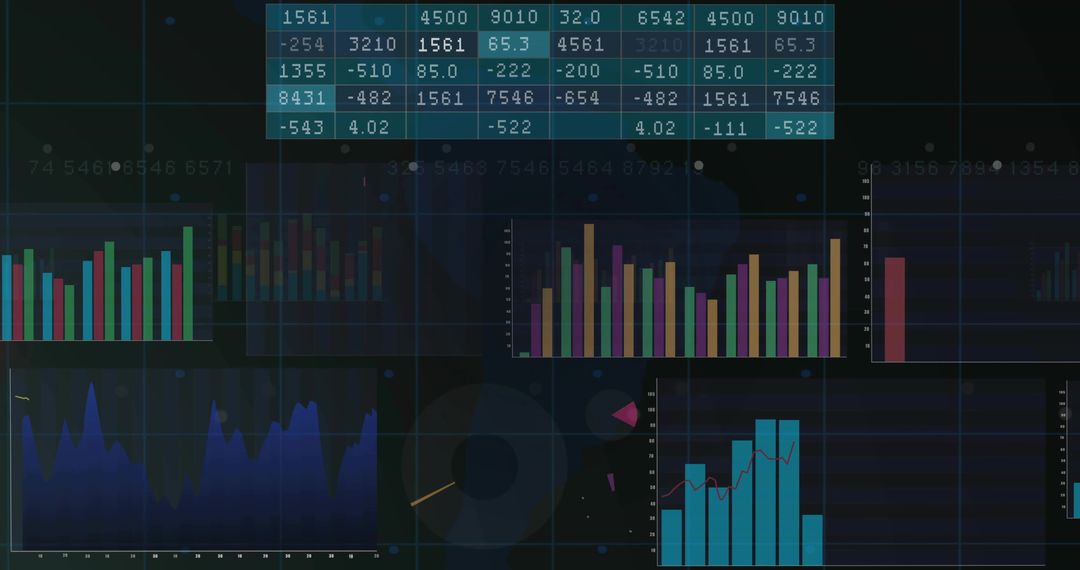
Visual depiction of complex financial data with various graphs and charts in vibrant colors set against a black background. Useful for illustrating financial analysis, economic trends, and data reporting in presentations, articles, and digital content related to business or finance.
Powered by 


2
downloads
downloads
Tags:
More
Credit Photo
If you would like to credit the Photo, here are some ways you can do so
Text Link
photo Link
<span class="text-link">
<span>
<a target="_blank" href=https://pikwizard.com/photo/abstract-financial-data-charts-and-graphs-on-black-background/ff6b74b62301c041b6c36f380f15db58/>PikWizard</a>
</span>
</span>
<span class="image-link">
<span
style="margin: 0 0 20px 0; display: inline-block; vertical-align: middle; width: 100%;"
>
<a
target="_blank"
href="https://pikwizard.com/photo/abstract-financial-data-charts-and-graphs-on-black-background/ff6b74b62301c041b6c36f380f15db58/"
style="text-decoration: none; font-size: 10px; margin: 0;"
>
<img src="https://pikwizard.com/pw/medium/ff6b74b62301c041b6c36f380f15db58.jpg" style="margin: 0; width: 100%;" alt="" />
<p style="font-size: 12px; margin: 0;">PikWizard</p>
</a>
</span>
</span>
Free (free of charge)
Free for personal and commercial use.
Author: Authentic Images
Similar Free Stock Images

Premium


Premium


Premium


Premium


Premium


Premium


Premium


Premium


Premium


Premium


Premium


Premium


Premium


Premium


Premium


Premium


Premium


Premium


Premium


Premium


Premium


Premium


Premium


Premium