- Home >
- Stock Photos >
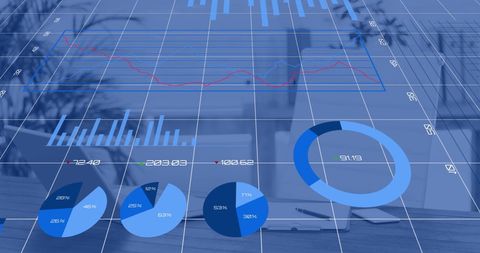
- Abstract Financial Data Charts in Digital Interface
Abstract Financial Data Charts in Digital Interface Image

Depicting various numerical and graphical data overlaid onto a grid, this image showcases digital charts used in financial analysis. As part of branding or content in finance, consulting, or technology contexts, such images effectively communicate complex data visually, abstracting computational growth or transformation mechanisms suitable for presentations, websites, or marketing materials.

downloads
Tags:
More
Credit Photo
If you would like to credit the Photo, here are some ways you can do so
Text Link
photo Link
<span class="text-link">
<span>
<a target="_blank" href=https://pikwizard.com/photo/abstract-financial-data-charts-in-digital-interface/25d7b94d311fbe56e90e432317eb45eb/>PikWizard</a>
</span>
</span>
<span class="image-link">
<span
style="margin: 0 0 20px 0; display: inline-block; vertical-align: middle; width: 100%;"
>
<a
target="_blank"
href="https://pikwizard.com/photo/abstract-financial-data-charts-in-digital-interface/25d7b94d311fbe56e90e432317eb45eb/"
style="text-decoration: none; font-size: 10px; margin: 0;"
>
<img src="https://pikwizard.com/pw/medium/25d7b94d311fbe56e90e432317eb45eb.jpg" style="margin: 0; width: 100%;" alt="" />
<p style="font-size: 12px; margin: 0;">PikWizard</p>
</a>
</span>
</span>
Free (free of charge)
Free for personal and commercial use.
Author: Awesome Content