
- Home >
- Stock Photos >
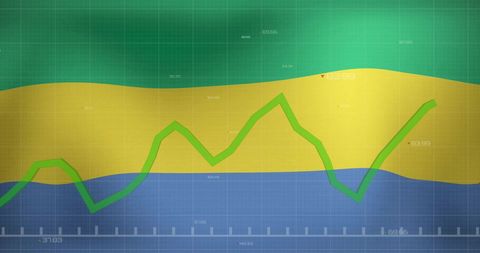
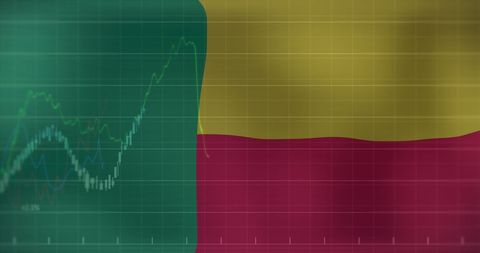
- Abstract Financial Data Charts Reflecting Economic Trends
Abstract Financial Data Charts Reflecting Economic Trends Image

Visual representation of financial data overlaid on colors related to the Hungarian flag, depicting stock market trends and analysis. Useful for illustrating economic reports, financial news articles, investment strategies, and economic growth discussions.
Powered by 


Credit Photo
If you would like to credit the Photo, here are some ways you can do so
Text Link
photo Link
<span class="text-link">
<span>
<a target="_blank" href=https://pikwizard.com/photo/abstract-financial-data-charts-reflecting-economic-trends/bfbbaa2c049945fc426ed44eeb0cdf7e/>PikWizard</a>
</span>
</span>
<span class="image-link">
<span
style="margin: 0 0 20px 0; display: inline-block; vertical-align: middle; width: 100%;"
>
<a
target="_blank"
href="https://pikwizard.com/photo/abstract-financial-data-charts-reflecting-economic-trends/bfbbaa2c049945fc426ed44eeb0cdf7e/"
style="text-decoration: none; font-size: 10px; margin: 0;"
>
<img src="https://pikwizard.com/pw/medium/bfbbaa2c049945fc426ed44eeb0cdf7e.jpg" style="margin: 0; width: 100%;" alt="" />
<p style="font-size: 12px; margin: 0;">PikWizard</p>
</a>
</span>
</span>
Free (free of charge)
Free for personal and commercial use.
Author: People Creations
Similar Free Stock Images

Premium


Premium


Premium


Premium

Premium


Premium

Premium


Premium


Premium


Premium

Premium


Premium


Premium


Premium


Premium


Premium


Premium


Premium


Premium


Premium


Premium

Premium


AI


Premium


Premium

Premium


Explore More Free Stock Images