- Home >
- Stock Photos >
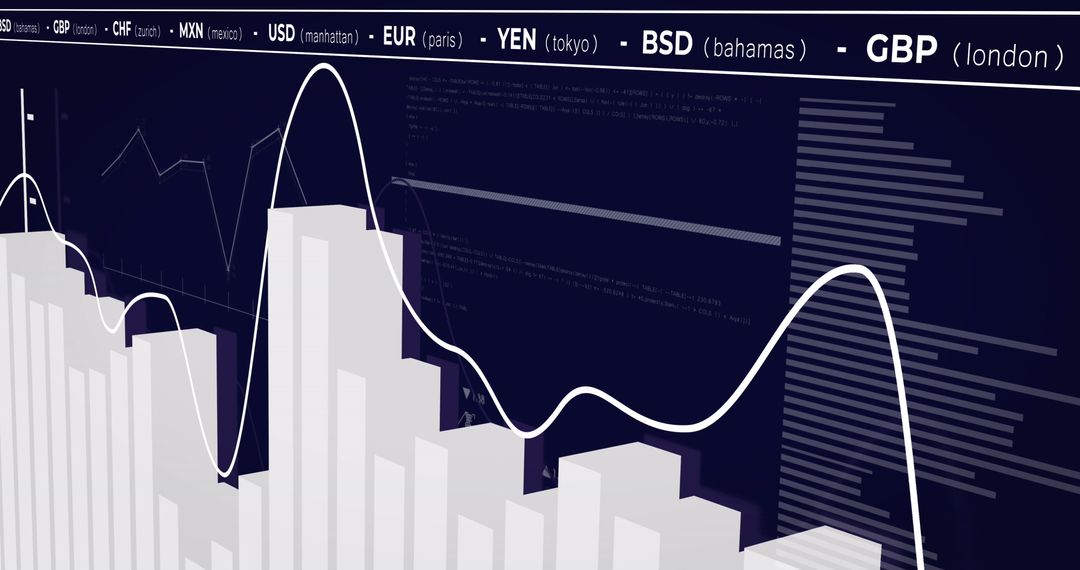
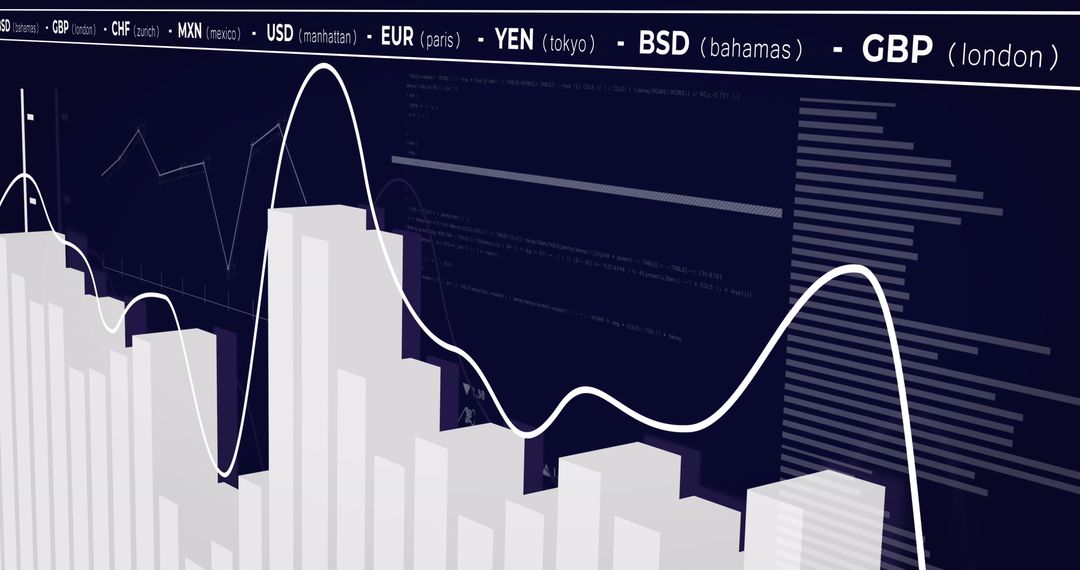
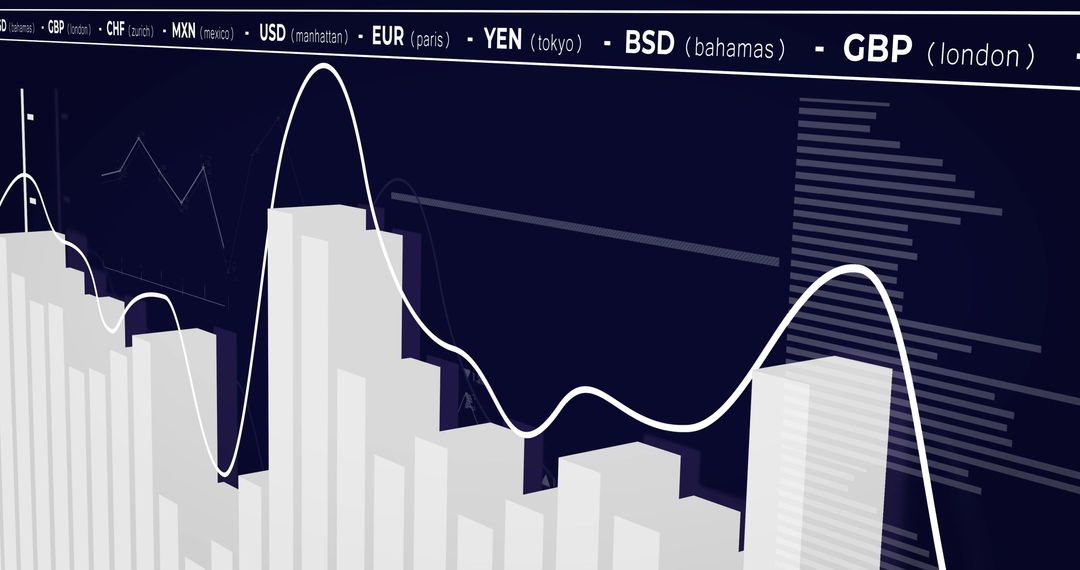
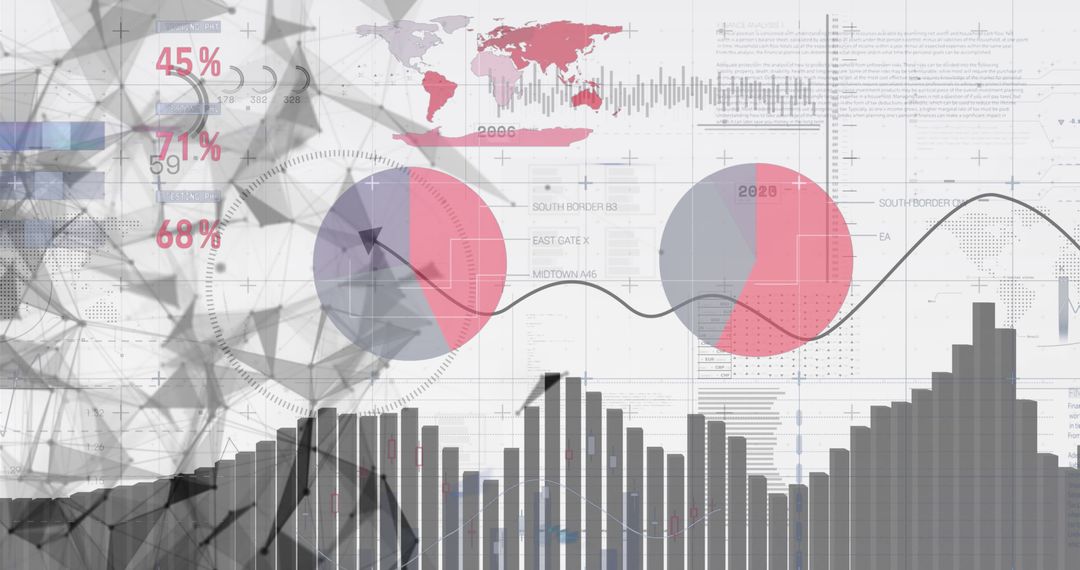
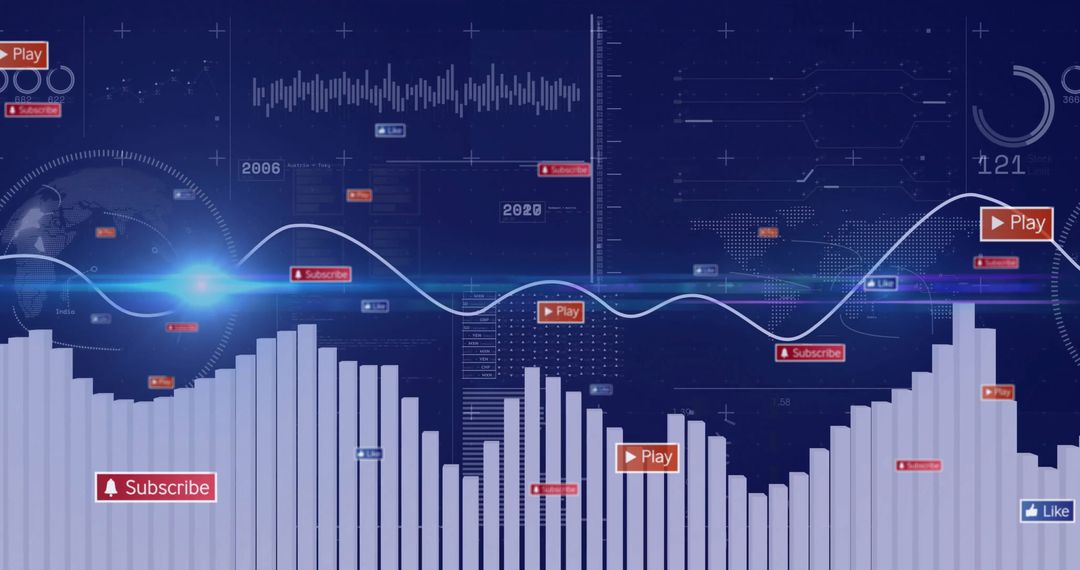
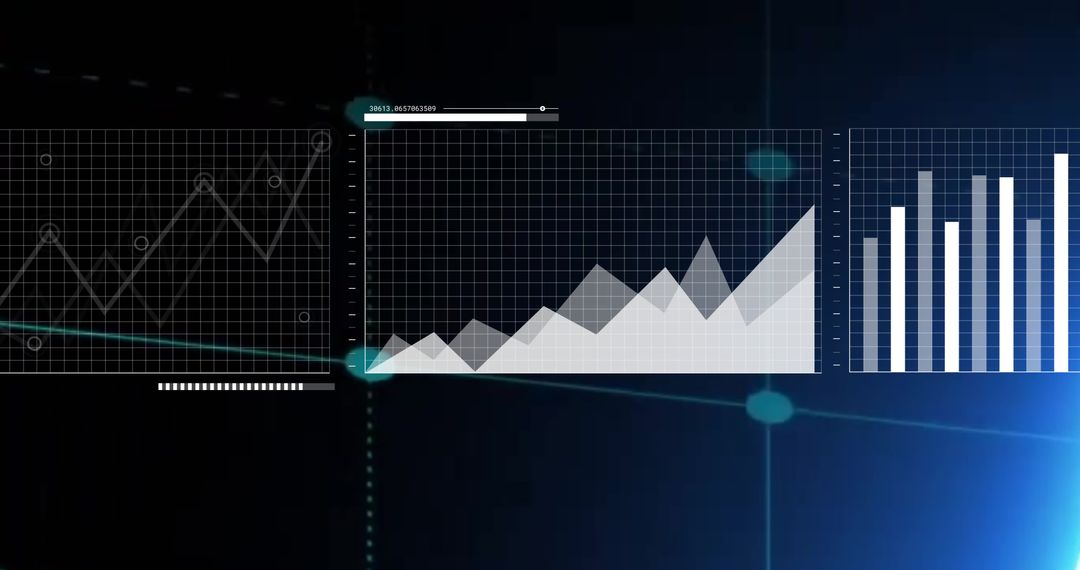
- Abstract Financial Data Charts with Analytics and Trends
Abstract Financial Data Charts with Analytics and Trends Image

Abstract blue background featuring various financial data visualizations including charts, graphs, and metrics like patterns and upward trends symbols. Ideal for use in presentations, financial reports, and educational materials highlighting data analysis, business forecasting, investment research, and statistical evaluation.
Powered by  - Get 15% off with code: PIKWIZARD15


2
downloads
downloads
Tags:
More
Credit Photo
If you would like to credit the Photo, here are some ways you can do so
Text Link
photo Link
<span class="text-link">
<span>
<a target="_blank" href=https://pikwizard.com/photo/abstract-financial-data-charts-with-analytics-and-trends/0576c127274fa908dd2f2489113fd412/>PikWizard</a>
</span>
</span>
<span class="image-link">
<span
style="margin: 0 0 20px 0; display: inline-block; vertical-align: middle; width: 100%;"
>
<a
target="_blank"
href="https://pikwizard.com/photo/abstract-financial-data-charts-with-analytics-and-trends/0576c127274fa908dd2f2489113fd412/"
style="text-decoration: none; font-size: 10px; margin: 0;"
>
<img src="https://pikwizard.com/pw/medium/0576c127274fa908dd2f2489113fd412.jpg" style="margin: 0; width: 100%;" alt="" />
<p style="font-size: 12px; margin: 0;">PikWizard</p>
</a>
</span>
</span>
Free (free of charge)
Free for personal and commercial use.
Author: Authentic Images
Similar Free Stock Images

Premium


Premium


Premium


Premium


Premium


Premium


Premium


Premium


Premium


Premium


Premium


Premium


Premium


Premium


Premium


Premium


Premium


Premium


Premium


Premium


Premium


Premium


Premium


Premium