1. Home > 
  2. Stock Photos > 
  3. Abstract Financial Data Diagrams on Black Background

Abstract Financial Data Diagrams on Black Background Image

Abstract Financial Data Diagrams on Black Background

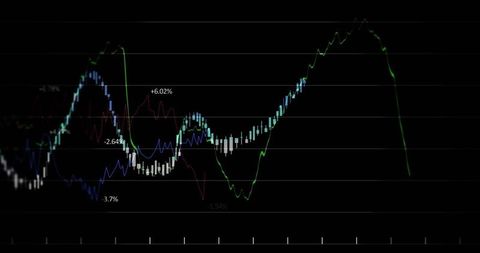
Dark background showcases various line graphs representing financial data, ideal for use in presentations centering on financial analysis, stock market trends, and economic forecasts. Suitable for articles discussing global business standards and technological applications in finance.

Powered by Shutterstock logo - Get 15% off with code: PIKWIZARD15
Man look at the dashboard with graphs and charts. Concept of data management system, business intelligence, data statistics, marketing analysis, key performance indicators (KPI) and analytics. - Powered by Shutterstock - Get 15% off with code: PIKWIZARD15Man look at the dashboard with graphs and charts. Concept of data management system, business intelligence, data statistics, marketing analysis, key performance indicators (KPI) and analytics. - Powered by Shutterstock - Get 15% off with code: PIKWIZARD15Using tablet pc, Consultant between bookkeepers and accounting lawyer consultation about asset, balance sheet, stock market statistics and yearly tax law, protect business from bribery. - Powered by Shutterstock - Get 15% off with code: PIKWIZARD153D blue bar graph rising, sotck market informations - Powered by Shutterstock - Get 15% off with code: PIKWIZARD15Man Typing Keyboard Laptop Hand.Project Manager Researching Process.Business Team Working Startup modern Office.Global Strategy Virtual Icon.Innovation Graphs Interfaces.Analyze market stock.Blurred - Powered by Shutterstock - Get 15% off with code: PIKWIZARD15

Credit Photo

If you would like to credit the Photo, here are some ways you can do so

Free (free of charge)

Free for personal and commercial use.

Author: Authentic Images

Similar Free Stock Images

Loading...
Dynamic Digital Data Visualization with Dot Graph Design
Premium
Rising glow arrows on white stairway as business chart steps on grid, blue background. Business economic and marketing growth graph process, higher goal, success, profit, financial investment concept.
Abstract Sound Waves on Dark Background
Glowing Cardiology Graph on Dark Background
Financial Data Flow against Urban Skyline Backdrop
Colorful Bar Graph on Dark Background Illustrates Data Trends
Falling Line Graph on Navy Background Illustrating Economic Decline
Digital Interface Showing Global Business Data Analytics
Premium
Beautiful 3D red bar graph fall down following the arrow.
Digital Data Analysis with Green Line Graph on Grid Background
Abstract Financial Graph with Rising Waves on Red Gradient
Futuristic Graph with Digital Globe Symbolizing Global Technology Connections
Slumpflation Concept with Graph and Digital Display
Analyzing Data Trends on Digital Graph Interface
Financial Data Processing with Digital Patterns for Global Business
Data Analytics Graphs on Digital Interface Background
Dynamic Financial Data Visualizations on Grid Interface
Data Analysis with Advanced Technology Interface Details Profusion
Colorful Data Visualization on Dark Background
Data Visualization with Rising Red Arrow and Floating Numbers
Dynamic Green Line Graph Depicting Financial Data
Premium
Data monetization concept with funnel and businessman
Premium
Financial graphs and data processing image over city skyline background. Finance, economy, analytics, technology, urban, stock market
Dynamic Financial Graphs Overlaying Modern Cityscape
Cityscape with Digital Stock Market Graphs and Statistics
Green Line Graph with Data Points on Grid Background
Premium
AI(Artificial Intelligence) and Financial Technology concept.Robot Hand Stacking pile of Coins,Financial technology, Stock chart,Investment,Fintech on white background.
Abstract Digital Data Graph and Diagrams on Gray Background
Financial Stock Market Data Visualization with Declining Trends
Digital Graphs and Data Visualization on Green Background
Futuristic Digital Representation of DNA Strand
Digital Data Processing with Chart in Futuristic Interface
Vibrant Financial Data Lines on Digital Graph Background
Graph Lines Portraying Financial Data Trends
Dynamic Financial Data Visualization over Urban Silhouette
Economic and Political Factors Influence Investment Trends
Financial Data Charts with World Map on Blue Digital Background
Rising Financial Graph on Dark Grid Background
Premium
Using tablet pc, Consultant between bookkeepers and accounting lawyer consultation about asset, balance sheet, stock market statistics and yearly tax law, protect business from bribery.
Digital Financial Data Display with Graph and Grid
Data Analytics and Financial Growth Indicators
Innovative Data Analysis with Dynamic Line Graph and Digital Elements
Futuristic Graph and Data Visualization Interface Design
Digital Forex Data Over City Skyline Visualizing Market Trends
Digital Financial Data Analysis with Graphs and Stock Market Trends
Data Trends and Analysis on 3D Digital Grid
Futuristic Digital Network Interface With Interactive Wave Patterns
Premium
Man Typing Laptop,use Smartphone Hand.Project Manager Researching Process.Business Team Work Startup modern Office.Global Strategy Virtual Icon.Innovation Graphs Interface.Analyze market stock.Blurred
Abstract Digital Finance Chart Showing Fluctuating Graph Lines
Digital Data Visualization with Trend Lines and Percentage Changes
Futuristic Global Finance Chart with Rotating Globe Animation
Rising Financial Data Graph on Digital Grid Background
Premium
Digital tablet showing charts
Dynamic Green Stock Market Chart with Upward Arrows
Digital Data Flow with Infographics Hologram
Dynamic Financial Data Processing in Green Sphere
Financial Data Analysis with Interactive Graphs
Line Graph Illustrating Data Trend on Green Digital Background
Upward Stock Market Arrow with Binary Code Background
Dynamic Financial Data Overlaid on Grid Background
Digital Data Processing with Graph and Grid Technology Interface
Premium
Woman Touching Display Digital Tablet Hand.Project Manager Researching Process.Business Team Working Startup modern Coworking.Analyze market stock.Using electronic device,paper,note wood table.Blurred
Digital Interface Visualizing DNA and Data Patterns
Futuristic Digital Graph Showing Data Trends on Analytic Interface
Futuristic Digital Interface with DNA and Brain Diagrams
Digital Financial Data Overlaying City Skyline at Dusk
Premium
business people analyze virtual graphic financial graph chart diagram on mobile laptop computer, digital technology, business strategy, stock market investment, business finance technology concept
Premium
Analytics Report Status Information Analysis Chart Graph Concept
Premium
Analytical data and development statistics. Web analytics and product testing techniques are being measured. A guy studies an SEO dashboard and a digital report.
Abstract Financial Graph with Bar and Line Charts on Dark Background
Digital Financial Data Analyzing Over Circular Grid Display
Digital Interface with Global Financial Graphs Background
Fluctuating Digital Stock Market Data Chart
Premium
Using tablet pc, Consultant between bookkeepers and accounting lawyer consultation about asset, balance sheet, stock market statistics and yearly tax law, protect business from bribery.
Premium
Man Use Smartphone Hand,touch screen.Project Manager Researching Process.Business Team Work Startup modern Office.Global Strategy Virtual Icon.Innovation Graphs Interface.Analyze market stock.Blurred
Stagflation Concept with Digital Financial Graphs
Digital Data Network with Dynamic Connections
Dynamic Data Visualization and Financial Growth Curves
Analyzing Stock Market Trends with Dynamic Graphs and Data
Premium
Woman Touching Screen Electronic Tablet Hand.Project Managers Researching Process.Business Team Working New Startup modern Office.International Digital Charts Interfaces.Analyze market stock.Blurred
Premium
Image of financial data processing over stadium. Global sport, finances and digital interface concept digitally generated image.
Rising Graph Line on Digital Green Grid Background
Green Data Graph on Black Digital Interface
Digital Data Visualization on Blue Background
Dynamic Energy Particle Wave Concept on Metallic Gray Background
Data Analysis Graphics on Digital Grid Background
NFT Financial Data Visualization with Digital Graph Overlay
Dynamic Financial Graphs Overlaying Urban Skyline
Premium
Stock market data on LED display concept.a large display of daily stock price and quotation.
Dynamic Financial Data on Digital Screen
Premium
Multi exposure of woman on-line shopping holding a credit card and financial graph drawing. Stock market E-commerce concept.
Green Line Graph on Dark Digital Grid
Digital Stock Market Graph Red Trendline on Green Background
Abstract Digital DNA Helix with Geometric Patterns and Nodes
Line Graphs on Digital Background Show Financial Data Trends
Abstract DNA Helix Digital Network
Neon Network on Purple Background with Glowing Connectivity Lines
Neon Green Electrocardiogram Wave on Black Background
Financial Data Graph Rendering Global Market Trends
Dynamic Financial Graph with Wavy Data Line over Navy Background
Abstract Financial Graph Illustration on Dark Background
Premium
Abstract virtual financial graph hologram on USA flag and sunset sky background, forex and investment concept. Multiexposure
Digital Finance: Modern Stock Market Analysis Display
Analyzing Accelerating Data Trends on Grid with Tech Insights
Financial Data Line Graph on Digital Display
Financial Graph Analysis on Green Grid Background
Premium
Artificial intelligence Digital file management, Investment financial global economy concept. Businessman using laptop analysing virtual global and trading graph, stock market trade, online business.
Premium
Stock market data on LED display concept. A large display of daily stock price and quotation.
Futuristic Financial Data Visualization on Digital Interface
Retro Video Display with Digital Interference Effect
Digital Finance Chart Overlaying Globe Background
Dynamic Financial Data Waves in Digital Cyber World
Premium
AI(Artificial Intelligence) and Financial Technology concept.Robot Hand Stacking pile of Coins,Financial technology,Stock chart,Investment,Fintech on white background.
Digital Data Processing Interface with Green Growth Chart
Financial Data Processing Visualization with Green Digital Grid
Data Visualization on Security Shield Interface for Cyber Security
Financial Data Analysis Vibrant Graphs on Blue Background
Premium
strategy analysis concept, Businessman working  financial Manager Researching Process accounting calculate analyse market graph data stock information review on the table in office.
Dynamic Red Line Graph With Data Points on Gridded Background
Financial Data Analysis with Futuristic Technology Interface
Fluctuating Financial Graph on Green Grid Background
Dynamic Financial Data Chart Showing Trend Analysis
Dynamic Financial Stock Market Analysis Display
Premium
Woman Touching Screen Electronic Tablet Hand.Project Managers Researching Process.Business Team Working New Startup modern Office.Digital Connections world wide interfaces.Analyze market stock.Blurred
Premium
Forex market charts on computer display. Business analysis diagram. Candle stick graph chart. Share price candlestick chart. Fundamental and technical analysis concept. Price chart bars.