- Home >
- Stock Photos >
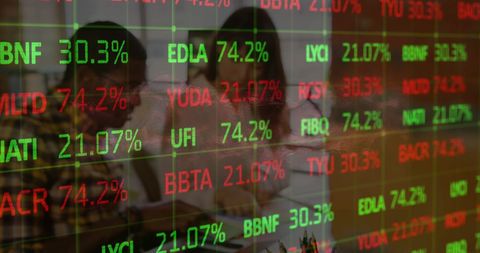
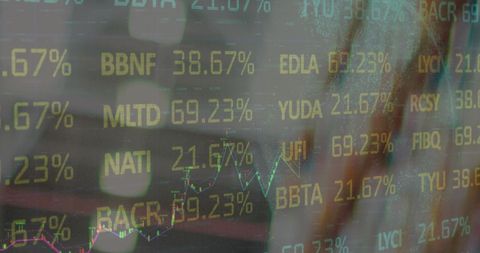
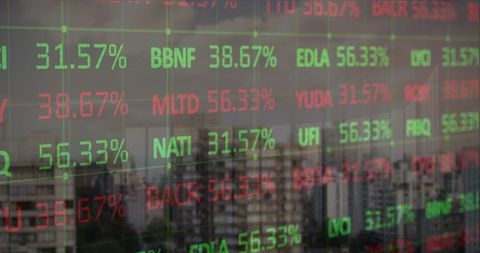
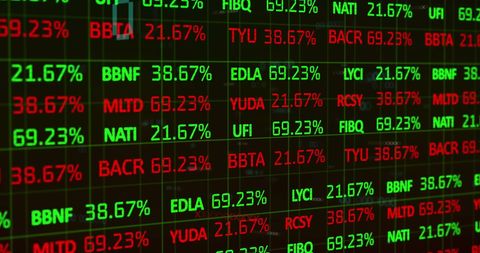
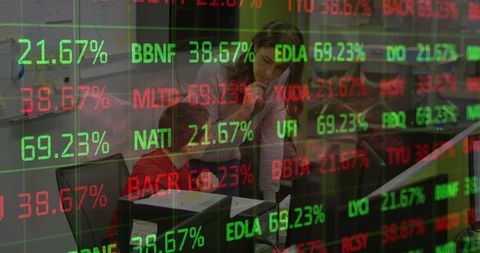
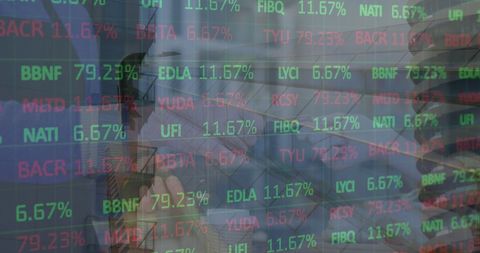
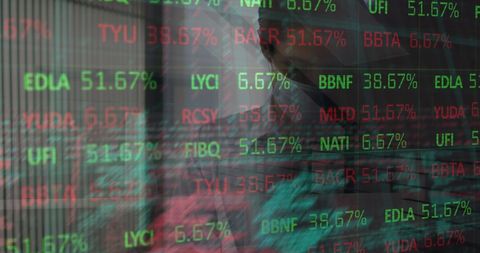
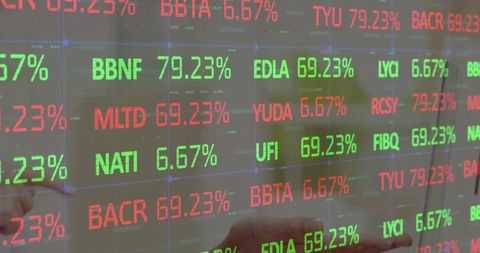
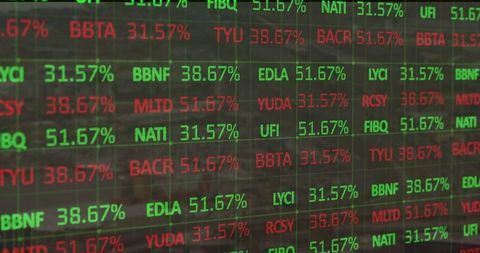
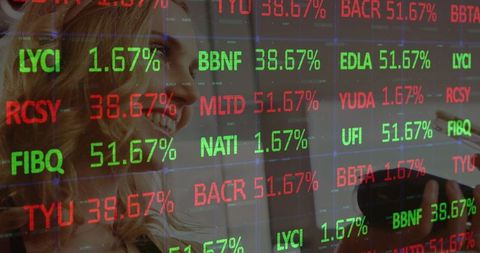
- Abstract Financial Data Display with Blurred Background
Abstract Financial Data Display with Blurred Background Image
Bright numbers and codes scroll across a transparent screen, displaying hypothetical financial data. Ideal for illustrating finance, trading, economic reports, business presentations, or digital backgrounds. The colors and format represent activity on stock markets and complex number processing, providing a modern, high-tech feel.

downloads
Tags:
More
Credit Photo
If you would like to credit the Photo, here are some ways you can do so
Text Link
photo Link
<span class="text-link">
<span>
<a target="_blank" href=https://pikwizard.com/photo/abstract-financial-data-display-with-blurred-background/bb23d664bac50858eed63d0afefb681b/>PikWizard</a>
</span>
</span>
<span class="image-link">
<span
style="margin: 0 0 20px 0; display: inline-block; vertical-align: middle; width: 100%;"
>
<a
target="_blank"
href="https://pikwizard.com/photo/abstract-financial-data-display-with-blurred-background/bb23d664bac50858eed63d0afefb681b/"
style="text-decoration: none; font-size: 10px; margin: 0;"
>
<img src="https://pikwizard.com/pw/medium/bb23d664bac50858eed63d0afefb681b.jpg" style="margin: 0; width: 100%;" alt="" />
<p style="font-size: 12px; margin: 0;">PikWizard</p>
</a>
</span>
</span>
Free (free of charge)
Free for personal and commercial use.
Author: Awesome Content