- Home >
- Stock Photos >
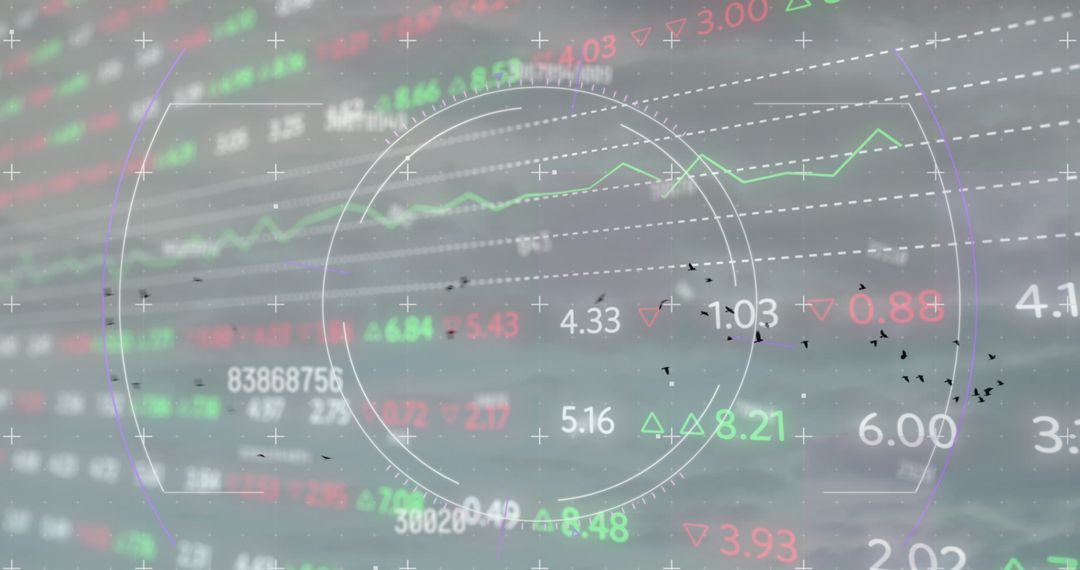
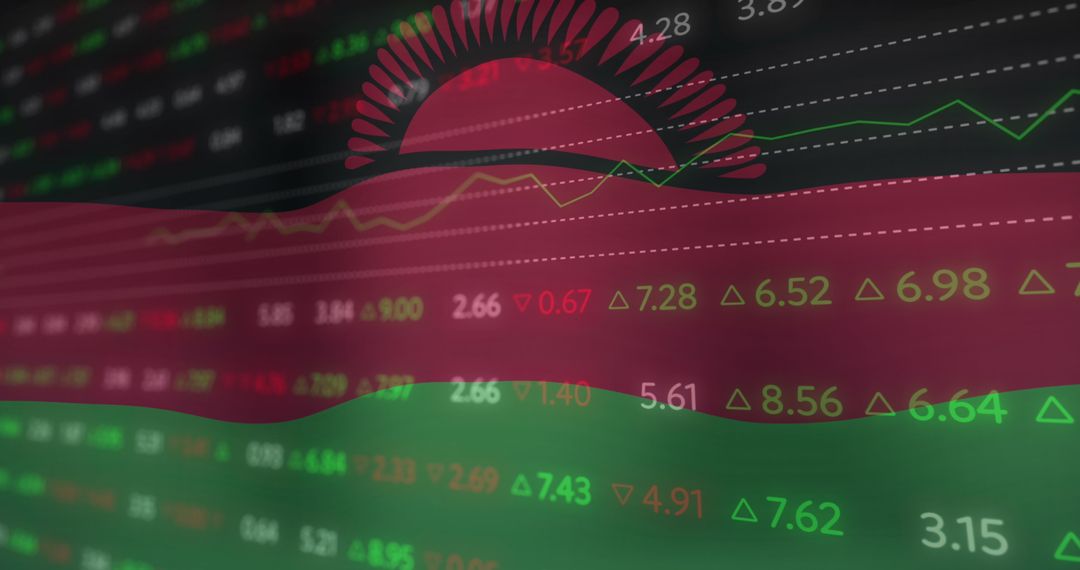
- Abstract Financial Data Display with Metrics and Charts
Abstract Financial Data Display with Metrics and Charts Image
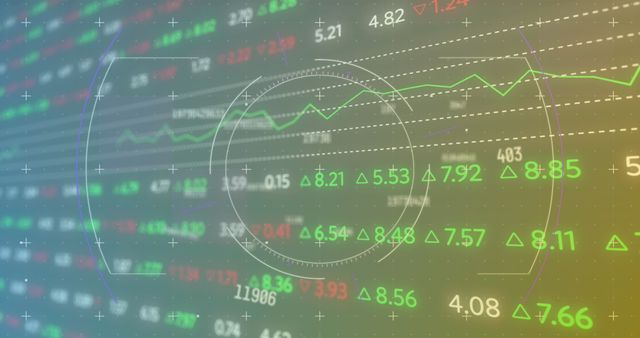
Abstract visualization of financial data includes charts, metrics, and data lines indicating fluctuation patterns. Useful for illustrating concepts related to global business, stock market activities, economic trend analysis, and digital data processing. Suitable for fintech presentations, investment strategies, or digital financial tools.
Powered by 


2
downloads
downloads
Tags:
More
Credit Photo
If you would like to credit the Photo, here are some ways you can do so
Text Link
photo Link
<span class="text-link">
<span>
<a target="_blank" href=https://pikwizard.com/photo/abstract-financial-data-display-with-metrics-and-charts/5443ec17427ab96c021ccb62411d9665/>PikWizard</a>
</span>
</span>
<span class="image-link">
<span
style="margin: 0 0 20px 0; display: inline-block; vertical-align: middle; width: 100%;"
>
<a
target="_blank"
href="https://pikwizard.com/photo/abstract-financial-data-display-with-metrics-and-charts/5443ec17427ab96c021ccb62411d9665/"
style="text-decoration: none; font-size: 10px; margin: 0;"
>
<img src="https://pikwizard.com/pw/medium/5443ec17427ab96c021ccb62411d9665.jpg" style="margin: 0; width: 100%;" alt="" />
<p style="font-size: 12px; margin: 0;">PikWizard</p>
</a>
</span>
</span>
Free (free of charge)
Free for personal and commercial use.
Author: Awesome Content
Similar Free Stock Images

Premium


Premium


Premium


Premium


Premium


Premium


Premium


Premium


Premium


Premium


Premium


Premium


Premium


Premium


Premium


Premium


Premium


Premium


Premium


Premium


Premium


Premium


Premium


Premium