- Home >
- Stock Photos >
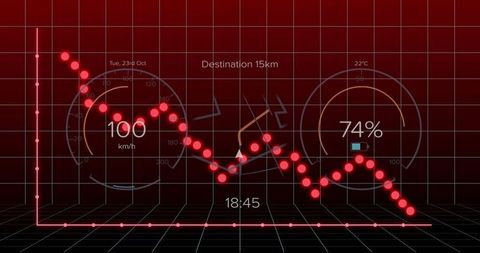
- Abstract Financial Data Display with Upward Graph Curves
Abstract Financial Data Display with Upward Graph Curves Image

Abstract display showcasing dynamic financial graphs on black background with swirling waves. Emphasizes positive market growth, useful for presentations involving global finance, economic forecasts, investment management and more.
Powered by 


downloads
Tags:
More
Credit Photo
If you would like to credit the Photo, here are some ways you can do so
Text Link
photo Link
<span class="text-link">
<span>
<a target="_blank" href=https://pikwizard.com/photo/abstract-financial-data-display-with-upward-graph-curves/09dfad24d3c3d8a319a2c90bc58a8341/>PikWizard</a>
</span>
</span>
<span class="image-link">
<span
style="margin: 0 0 20px 0; display: inline-block; vertical-align: middle; width: 100%;"
>
<a
target="_blank"
href="https://pikwizard.com/photo/abstract-financial-data-display-with-upward-graph-curves/09dfad24d3c3d8a319a2c90bc58a8341/"
style="text-decoration: none; font-size: 10px; margin: 0;"
>
<img src="https://pikwizard.com/pw/medium/09dfad24d3c3d8a319a2c90bc58a8341.jpg" style="margin: 0; width: 100%;" alt="" />
<p style="font-size: 12px; margin: 0;">PikWizard</p>
</a>
</span>
</span>
Free (free of charge)
Free for personal and commercial use.
Author: Awesome Content
Similar Free Stock Images
Loading...

Premium


Premium

Premium


Premium


Premium


Premium


Premium


Premium


Premium


Premium


Premium


Premium


Premium

Premium

Premium


Premium


Premium


Premium


Premium


Premium


Premium


Premium


Premium


Premium


Premium