
- Home >
- Stock Photos >
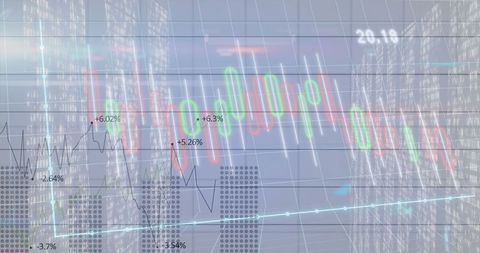
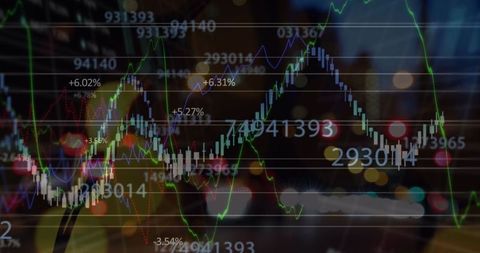
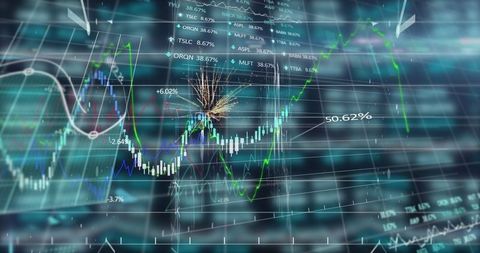
- Abstract Financial Data Graph with Candlestick Patterns
Abstract Financial Data Graph with Candlestick Patterns Image
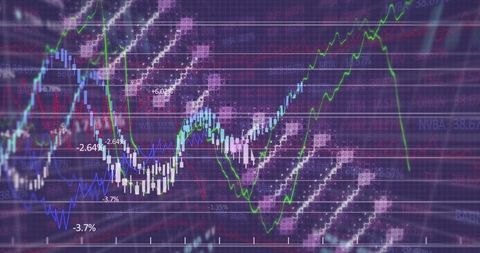
Vibrant depiction of financial data intricately illustrated with candlestick patterns, line graphs, and superimposed with technological elements like hexagon overlays and percentage change labels. Suitable for financial presentations, analytics reports, or technology installations emphasizing data innovation and real-time market tracking.
Powered by 


downloads
Tags:
More
Credit Photo
If you would like to credit the Photo, here are some ways you can do so
Text Link
photo Link
<span class="text-link">
<span>
<a target="_blank" href=https://pikwizard.com/photo/abstract-financial-data-graph-with-candlestick-patterns/be626a07760a08409e9867ddb58c9c4b/>PikWizard</a>
</span>
</span>
<span class="image-link">
<span
style="margin: 0 0 20px 0; display: inline-block; vertical-align: middle; width: 100%;"
>
<a
target="_blank"
href="https://pikwizard.com/photo/abstract-financial-data-graph-with-candlestick-patterns/be626a07760a08409e9867ddb58c9c4b/"
style="text-decoration: none; font-size: 10px; margin: 0;"
>
<img src="https://pikwizard.com/pw/medium/be626a07760a08409e9867ddb58c9c4b.jpg" style="margin: 0; width: 100%;" alt="" />
<p style="font-size: 12px; margin: 0;">PikWizard</p>
</a>
</span>
</span>
Free (free of charge)
Free for personal and commercial use.
Author: People Creations
Similar Free Stock Images

Premium


Premium

Premium


Premium


Premium


Premium


Premium


Premium


Premium


Premium

Premium


Premium

Premium


Premium


Premium


Premium


Premium


Premium


Premium

Premium


Premium


Premium


Premium
Premium


Premium


Explore More Free Stock Images