- Home >
- Stock Photos >
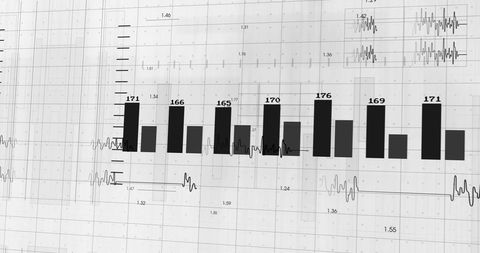
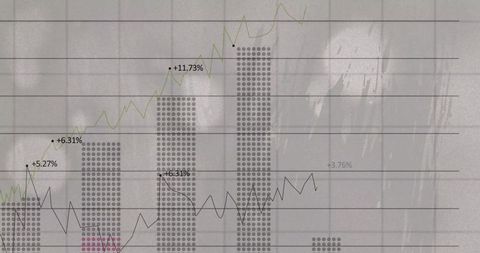
- Abstract Financial Data Graph with Digital Interface Elements
Abstract Financial Data Graph with Digital Interface Elements Image

Abstract bar and line graph set against digital grid background, showcasing financial analytics and data processing. Suitable for illustrating presentations related to finance, investment strategies, or technology-based business solutions. Can be used in blogs, articles, or reports focused on performance analysis, technology integration in business, or digital finance trends.

downloads
Tags:
More
Credit Photo
If you would like to credit the Photo, here are some ways you can do so
Text Link
photo Link
<span class="text-link">
<span>
<a target="_blank" href=https://pikwizard.com/photo/abstract-financial-data-graph-with-digital-interface-elements/0ad1c02b040080b81e7788d2395dffad/>PikWizard</a>
</span>
</span>
<span class="image-link">
<span
style="margin: 0 0 20px 0; display: inline-block; vertical-align: middle; width: 100%;"
>
<a
target="_blank"
href="https://pikwizard.com/photo/abstract-financial-data-graph-with-digital-interface-elements/0ad1c02b040080b81e7788d2395dffad/"
style="text-decoration: none; font-size: 10px; margin: 0;"
>
<img src="https://pikwizard.com/pw/medium/0ad1c02b040080b81e7788d2395dffad.jpg" style="margin: 0; width: 100%;" alt="" />
<p style="font-size: 12px; margin: 0;">PikWizard</p>
</a>
</span>
</span>
Free (free of charge)
Free for personal and commercial use.
Author: Awesome Content