
- Home >
- Stock Photos >
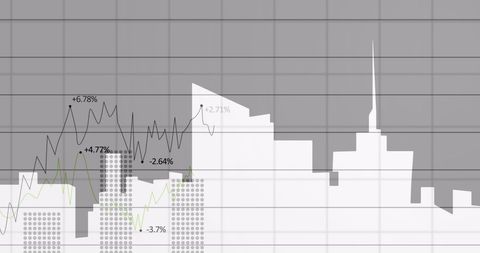
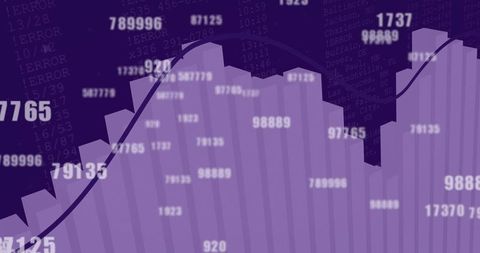
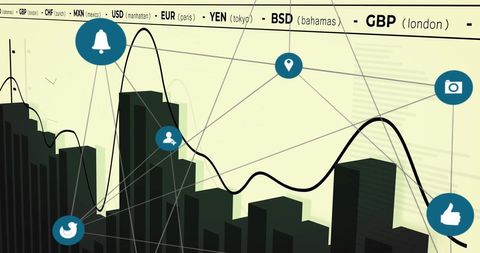
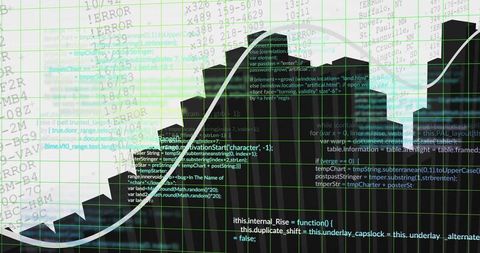
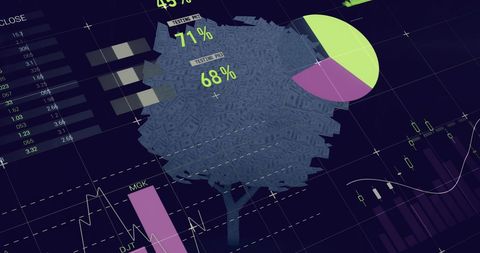
- Abstract Financial Data Graph with Digital Overlay
Abstract Financial Data Graph with Digital Overlay Image

This depiction merges abstract financial data visualization with a modern, digital interface. Featuring numbers, charts, and futuristic graphs on a dark background, it suggests concepts of stock market dynamics, economic forecasting, or information technology. Ideal for use in finance-themed content, business presentations, or articles about global market trends and financial analysis.
Powered by  - Get 15% off with code: PIKWIZARD15


downloads
Tags:
More
Credit Photo
If you would like to credit the Photo, here are some ways you can do so
Text Link
photo Link
<span class="text-link">
<span>
<a target="_blank" href=https://pikwizard.com/photo/abstract-financial-data-graph-with-digital-overlay/57fba2fbf2c7d8f765678f43f830fbd7/>PikWizard</a>
</span>
</span>
<span class="image-link">
<span
style="margin: 0 0 20px 0; display: inline-block; vertical-align: middle; width: 100%;"
>
<a
target="_blank"
href="https://pikwizard.com/photo/abstract-financial-data-graph-with-digital-overlay/57fba2fbf2c7d8f765678f43f830fbd7/"
style="text-decoration: none; font-size: 10px; margin: 0;"
>
<img src="https://pikwizard.com/pw/medium/57fba2fbf2c7d8f765678f43f830fbd7.jpg" style="margin: 0; width: 100%;" alt="" />
<p style="font-size: 12px; margin: 0;">PikWizard</p>
</a>
</span>
</span>
Free (free of charge)
Free for personal and commercial use.
Author: Awesome Content
Similar Free Stock Images

Premium


Premium


Premium


Premium


Premium


Premium


Premium


Premium


Premium

Premium


Premium


Premium

Premium

Premium


Premium


Premium

Premium


Premium

Premium


Premium

Premium

Premium

Premium


Premium


Premium

Explore More Free Stock Images