1. Home > 
  2. Stock Photos > 
  3. Abstract Financial Data Graphical Representation

Abstract Financial Data Graphical Representation Image

Abstract Financial Data Graphical Representation

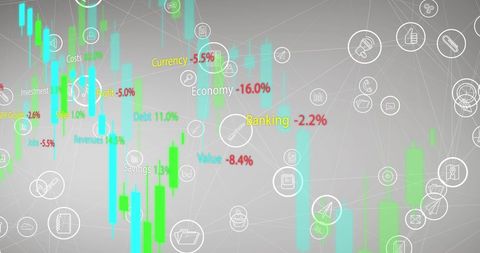
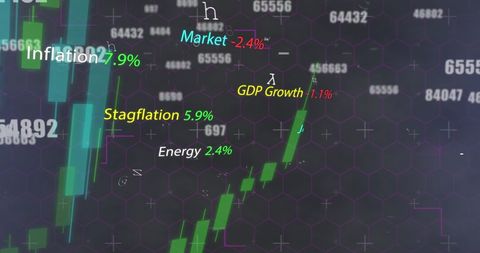
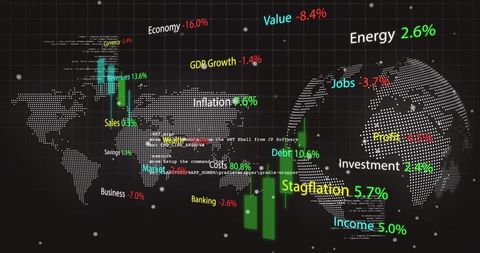
Illustration of shifting numerical data and graphs, depicting complex financial trends. Suitable for use in financial reports, presentations on stock market performance, economic trend analysis, and investment platforms. Highlights progression and insights in business growth and strategies.

Powered by Adobe logo

Dynamic blue and green digital stock market graph with bar charts and lines on a dark background, representing financial data analysis, investment trends, business growth, and global economy fluctuat - Powered by AdobeAn analyst uses a computer and dashboard for data business analysis and Data Management System with KPI and metrics connected to the database for technology finance, operations, sales, marketing  - Powered by AdobeTwo professional analyzing financial data graphs, charts on laptop display at a modern workspace. Financial analysis or business evaluation concept - Powered by AdobeBusiness documents analysis research financial reports charts magnifying glass sticky notes detailed data review - Powered by AdobeA business professional analyzing futuristic digital graphs and analytics dashboards on a tablet, showcasing data visualization, financial growth, and business intelligence in a modern tech environmen - Powered by Adobe

Credit Photo

If you would like to credit the Photo, here are some ways you can do so

Free (free of charge)

Free for personal and commercial use.

Author: People Creations

Similar Free Stock Images

Floating Numbers in Digital Grid Network
Premium
ESG, Environment and Investment Green plants growing in front of financial graphs and charts.
Abstract Network with Digital Connections and Data Points
Bitcoin Volatility Amid Geopolitical Tension
Futuristic Global Networking Concept with Data Visualization
Digital Data Analysis with Financial Graphs Interface
Premium
Analyzing financial charts and data reports in modern office setting
Dynamic Stock Market Trends and Data Visualizations
Global Market Trends Data Visualization with Business Metrics Overlay
Digital Wi-Fi Connectivity Symbol with Data Flow Lines
Futuristic Interface with Mathematics and Network Icons
Premium
Laptop screen displaying financial data charts.
Digital Interface Displaying Global Data Processing Across World Map
Abstract AI Concept with Geometric Patterns and Digital Brain
Neon Battery Icons Over Economic Data
Digital Data Visualization with Financial Analytics and Metrics
Premium
Magnifying glass over financial charts and graphs showing data analysis and growth
Digital Fingerprint with Changing Numbers and floating Molecules
Holographic Financial Graphs and Data Representation
Digital Email Icon Superimposed Over Urban Cityscape with Charts
Digital Graph and Data Processing Over World Map Interface
Premium
Two glowing spheres with financial graphs inside balance on a seesaw, representing comparison and equilibrium in data or market analysis.
Abstract Digital Network Visualization on Green Background
Data Processing Network with Global Business Interface
Analyzing Financial Data and Economic Trends Concept
Futuristic Digital Interface with Data Analytics in Motion
Premium
A corporate leader navigating financial graphs on a digital screen illustrating effective strategies for reducing operational costs. This image captures the essence of financial savings
Global Finance and Data Processing Visualization
Digital Interface with World Map and Analytical Graphs
Global Communication Concept with Digital Globe and Multimedia Alerts
Futuristic Data Visualization with Floating UI Elements in Outer Space
Financial Data Over World Map Interfacing with Digital Connections
Digital Interface with Chemical Structures and Data Analysis
Premium
Laptop, investment graphs and business woman reading IPO analytics, financial bank chart or accounting value, info or stocks. Trade price, admin data analysis and profile of broker review statistics
Global Bitcoin Trading Network Abstract Concept
Abstract Financial Data Overlay and Digital Interface Elements
Financial Data Visualization with Statistics and Graphs
Data Visualization with Finance Icons and Chart Streamlines
Premium
Business report showing charts and graphs on a clipboard for data analysis on transparent background
Global Data Network Represented by Digital World Map
Digital Financial Graphs Overlay in Futuristic Urban Background
Digital Financial Analysis with Vibant Graphs and Data Points
Global Economic Data Dynamics with 3D Earth
Premium
A professional analyzing financial data using a digital tablet with dynamic charts and graphs.
Digital Representation of Financial Data Trends
Dynamic Social Media Metrics Visualization with Holographic Graphs
Digital Financial Data and Cyber Technology Concept
Global Financial Data Analysis with Digital Graphics
Premium
Interactive Data Analysis and Forecasting. Business and finance concept.
Dynamic Financial Data on Orange Background
Social Networking on Digital Green Globe Background
Abstract Digital Graph with Trend Lines and Data Points
Digital Graphs and Codes Futuristic Technology Background
Premium
Professional Latina woman sits at desk in coworking office, focused on her work, looking at computer screen displaying financial charts and stock market data related to trading or financial analysis
Digital Network Globe with Medical Data Icons and Global Connections
Neon Circular Shapes Over Stock Market Data Visualization
Digital Data Streams Intersecting Global Sphere
Digital Malware Attack Visualization with Binary Code
Premium
Green arrow pointing upward on financial graph. Business growth chart with rising trend line. Digital stock market data visualization for investment analysis
Numeric Data Flow with Graphs on Digital Interface
Digital Data Connections across Global Map and Network
Neon Network Void with Orange Node Chains and Streaming Binary Data for Cyber Tech Design
Cybersecurity Threat Alerts on Digital Interface
Global Financial Data Processing Digital Interface
Russian Ruble Symbol with Rotating Safe Lock and Data Graphics
Premium
Financial market data analysis with glowing 3D bar and line charts on dark background showing economic trends and growth concept visualization. 3D Rendering
Abstract Financial Data and Graph with Arrows
Digital Network Interface with Data Elements
Global Data Integration with Digital Interface
Floating Business Figures in Digital Finance Display
Premium
Chess pieces on board with financial graphs overlay. Business strategy concept, decision making, competitive analysis, investment planning visualized through strategic game setup, market data.
Advanced Financial Data Processing and Analysis Interface
Futuristic Digital Networking and Data Analysis Concept
Global Finance Graphics Showing Market Data on World Map
Futuristic Digital Data and Line Graph Analysis Theme
Premium
Dynamic workspace featuring financial graphs and a laptop, illustrating data analysis and business strategy concepts clearly.
Global Finance and Technology Interface with Digital Networks
Digital Stock Market Analysis with Cityscape Background
Financial Data Across Global Digital Network
Connected Icons and Numbers Representing Global Digital Network
Premium
Abstract representation of financial growth with glowing graphs and data patterns in dark background
Digital Social Media Icons Amid Financial Data Visualization
Cryptocurrency and Dollar Symbols on Digital Background
Cityscape with Digital Finance Data Display Overlay
Digital Stock Market Growth with Data Visualization
Premium
Close-up of stylish tortoiseshell eyeglasses resting on financial charts and graphs with colorful data visualizations
Dynamic Financial Data Visualization with Digital Interface
Dynamic Data Analysis Chart on Dark Technological Background
Digital Numbers and Data Patterns Flowing on Red Background
Digital Data Processing Overlay on World Map Visual Background
Premium
Businessman analyzing financial data on futuristic digital screen with graphs and charts on a dark background, showcasing the finance growth concept.
Digital Candlestick Chart Visualization on Futuristic Dashboard
Flowing DNA helix crossing digital dashboard with hex clusters, circuit lines, data nodes
Digital Forex Data Visualization with Growing Trend
Abstract Global Financial Data Overlay with Digital Interface
Rotating Ruble Symbol on Digital Graph Background
Digital World Map with Data Network Visualization and Icons
Premium
A confident businessman presents financial data to a diverse team during a corporate meeting.
Futuristic Financial Data Analytics With Digital Interface
Futuristic Digital Financial Data Visualization with Purple Wave Patterns
Global Business Trends and Financial Data Visualization
Data Processing Technology on World Map Interface
Premium
Business charts graphs analysis with calculator and magnifying glass
Digital Graph Showing Data Processing on Dark Tech Background
Analyzing Global Finance Trends with High-Tech Data Visualization
Futuristic Digital Interface with Scanning Graphic Over Blue Purple Blurred Light Trails
Digital Data Analytics: Financial Trends and Forecasting
Premium
Transparent or png stock market investment trading graph growth.Trade business analytics graph and financial chart.
Global Networking Concepts with Digital Data Visualization Globe
Financial Data Analysis Depicting Economic Indicators and Trends
Digital Stock Market Data with Graphs and Numbers in Hologram Style
Dynamic Financial Data Visualization with Holographic Numbers
Premium
Manager touches growth graph on analytics dashboard. Business data analysis reports with marketing finance management strategy. Digital charts graphs increase business performance, sales statistic
Abstract Financial Data on Blue Digital Background
Global Cloud Computing with Financial Data Visualization
Data Network Visualization with Digital Interface Icons
Global Data Processing Interface with Medical Icons
Premium
Multiple computer monitors displaying financial charts and graphs in a dimly lit office setting data
Digital Data Processing Display with Statistical Graphs
Digital Currency Values on Purple Background Concept
Digital Data Display on World Map Highlighting Global Networks
Global Data Visualization on Digital World Map Technology Background
Premium
Data Examination: A magnifying glass hovers over financial reports and charts on a sky-blue surface, providing an overview of the business analysis.
Glowing Abstract Circuitry Flowing Across Neon Green Canvas with Luminous Traces