- Home >
- Stock Photos >
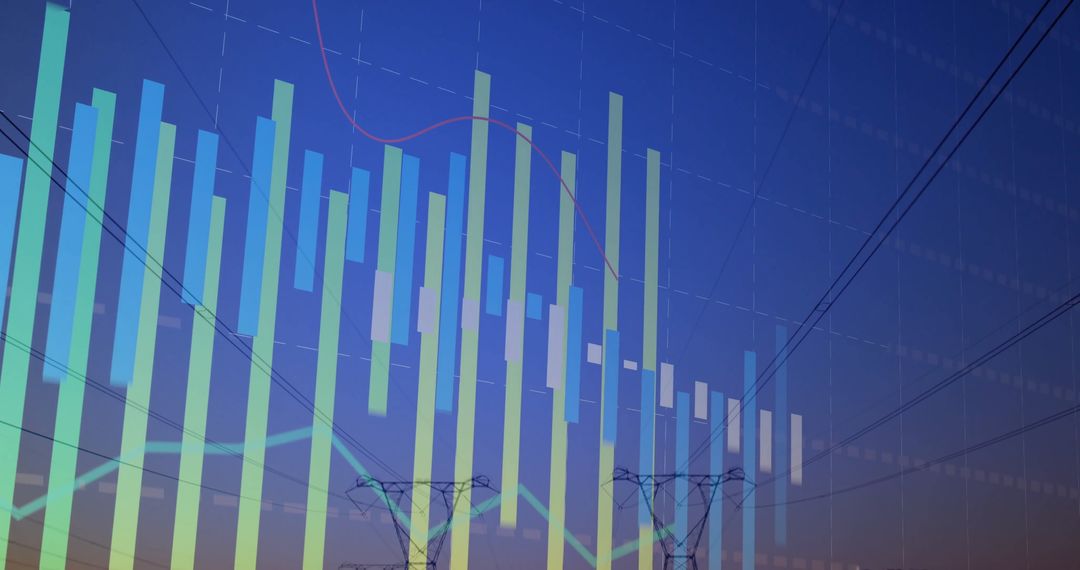
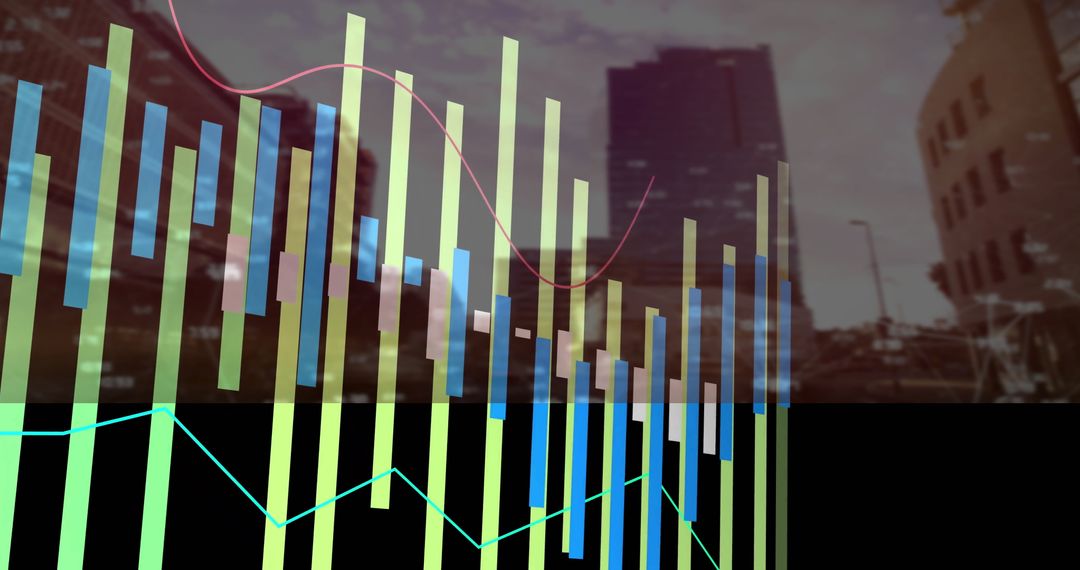
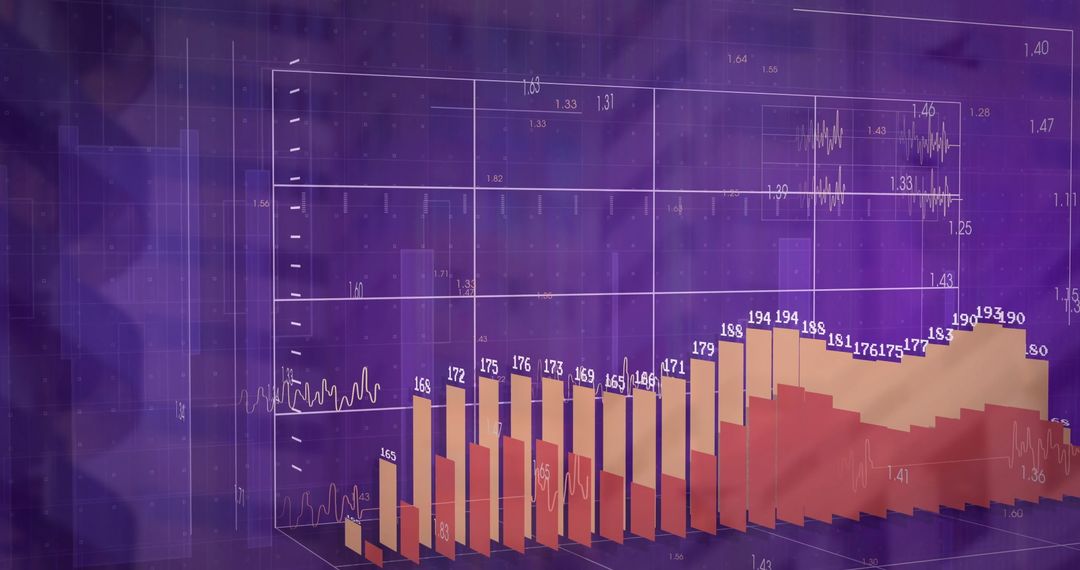
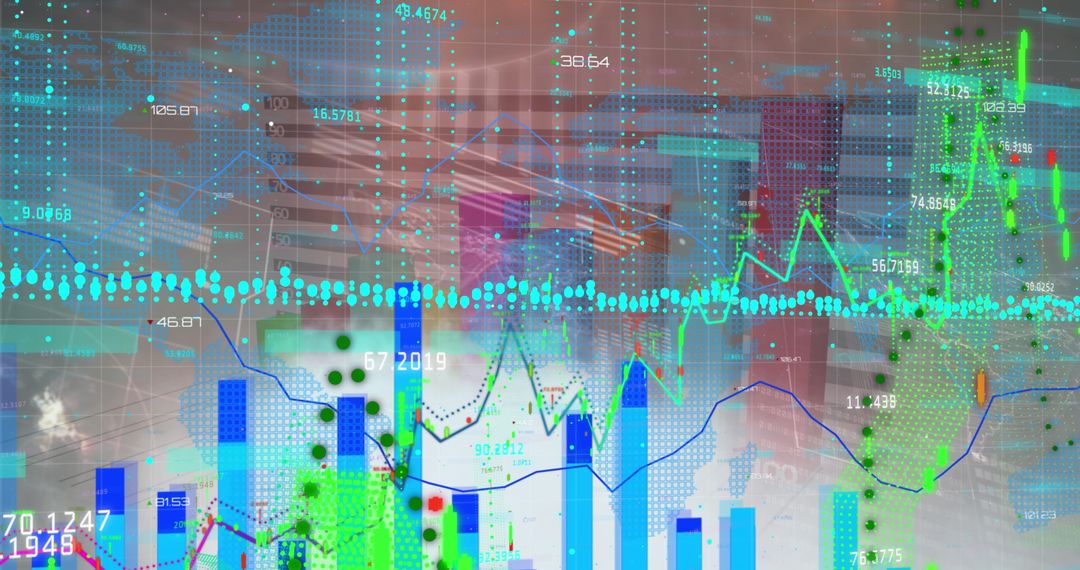
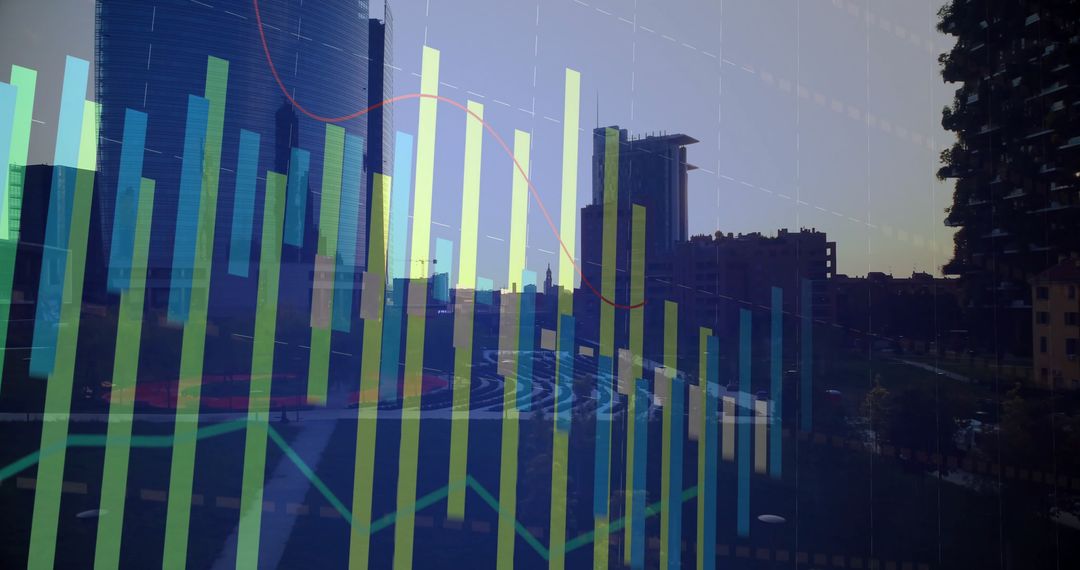
- Abstract Financial Data Graphics with Modern Bar and Line Charts
Abstract Financial Data Graphics with Modern Bar and Line Charts Image

This image showcases abstract financial data graphics, featuring vibrant bar and line charts over a blurred skyline. An excellent fit for business presentations, finance workshops, or educational materials illustrating data trends and analytic reports. It can enhance presentations meant for illustrating financial growth or economic analysis, providing a modern and dynamic aesthetic.
Powered by 


0
downloads
downloads
Tags:
More
Credit Photo
If you would like to credit the Photo, here are some ways you can do so
Text Link
photo Link
<span class="text-link">
<span>
<a target="_blank" href=https://pikwizard.com/photo/abstract-financial-data-graphics-with-modern-bar-and-line-charts/53b2359c68803dd7ab885a9f12e5aaa5/>PikWizard</a>
</span>
</span>
<span class="image-link">
<span
style="margin: 0 0 20px 0; display: inline-block; vertical-align: middle; width: 100%;"
>
<a
target="_blank"
href="https://pikwizard.com/photo/abstract-financial-data-graphics-with-modern-bar-and-line-charts/53b2359c68803dd7ab885a9f12e5aaa5/"
style="text-decoration: none; font-size: 10px; margin: 0;"
>
<img src="https://pikwizard.com/pw/medium/53b2359c68803dd7ab885a9f12e5aaa5.jpg" style="margin: 0; width: 100%;" alt="" />
<p style="font-size: 12px; margin: 0;">PikWizard</p>
</a>
</span>
</span>
Free (free of charge)
Free for personal and commercial use.
Author: Authentic Images
Similar Free Stock Images

Premium


Premium


Premium


Premium


Premium


Premium


Premium


Premium


Premium


Premium


Premium


Premium


Premium


Premium


Premium


Premium


Premium


Premium


Premium


Premium


Premium


Premium


Premium


Premium