- Home >
- Stock Photos >
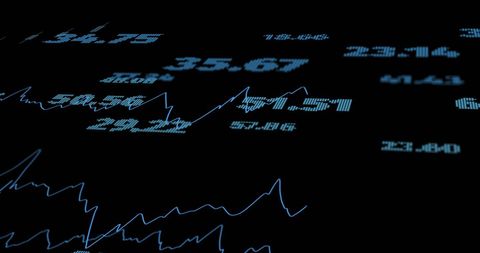
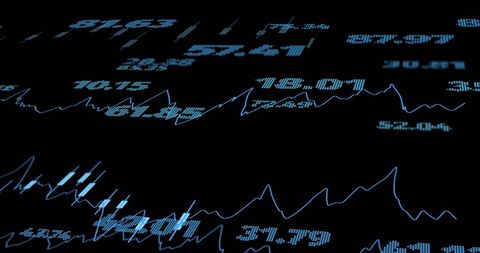
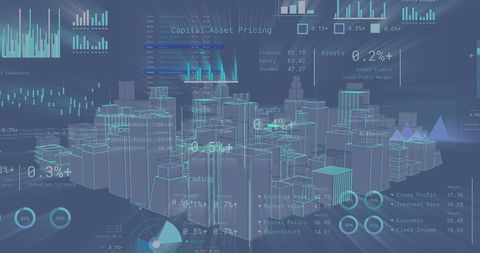
- Abstract Financial Data on Digital Graph Background
Abstract Financial Data on Digital Graph Background Image

This abstract graphical representation is ideal for illustrating financial analysis, stock market dynamics, and data visualization. Perfect for use in articles about technology in finance, business presentations, or decorative backgrounds in economic reports. It can enhance content related to statistical analysis and technical assessments.

downloads
Tags:
More
Credit Photo
If you would like to credit the Photo, here are some ways you can do so
Text Link
photo Link
<span class="text-link">
<span>
<a target="_blank" href=https://pikwizard.com/photo/abstract-financial-data-on-digital-graph-background/c5c81115283445698ebb745d9e5b37dc/>PikWizard</a>
</span>
</span>
<span class="image-link">
<span
style="margin: 0 0 20px 0; display: inline-block; vertical-align: middle; width: 100%;"
>
<a
target="_blank"
href="https://pikwizard.com/photo/abstract-financial-data-on-digital-graph-background/c5c81115283445698ebb745d9e5b37dc/"
style="text-decoration: none; font-size: 10px; margin: 0;"
>
<img src="https://pikwizard.com/pw/medium/c5c81115283445698ebb745d9e5b37dc.jpg" style="margin: 0; width: 100%;" alt="" />
<p style="font-size: 12px; margin: 0;">PikWizard</p>
</a>
</span>
</span>
Free (free of charge)
Free for personal and commercial use.
Author: Awesome Content