
- Home >
- Stock Photos >
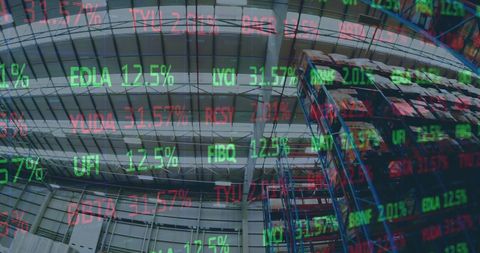
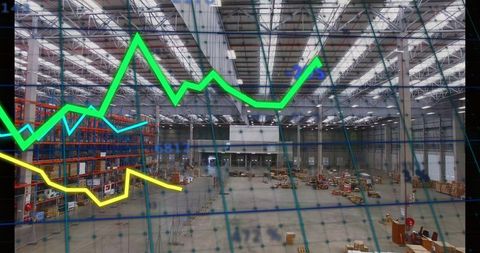
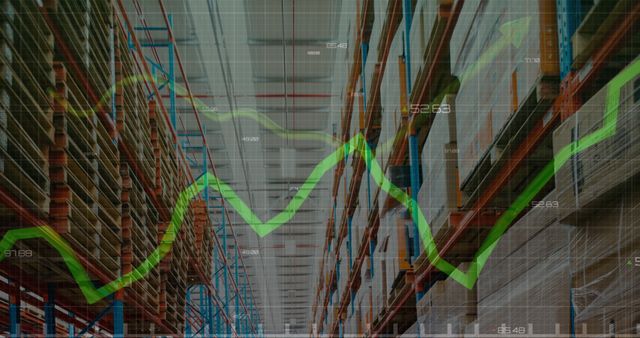
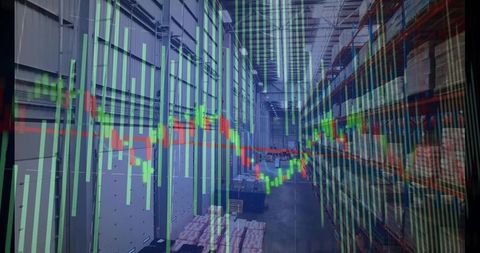
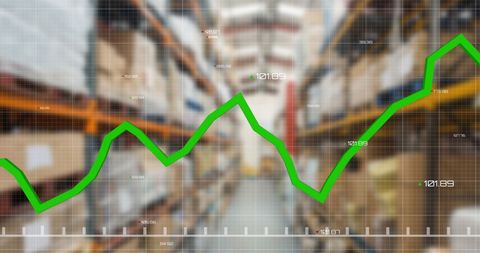
- Abstract Financial Data Overlapping Warehouse
Abstract Financial Data Overlapping Warehouse Image

Colorful digital data and graphs overlaying a blurred warehouse background, conveying themes of finance, economy, industry impact on business growth. Useful for articles or presentations focused on economic trends or market analysis. Ideal for adding visual interest to blog posts or educational materials about financial markets.
Powered by  - Get 15% off with code: PIKWIZARD15


downloads
Tags:
More
Credit Photo
If you would like to credit the Photo, here are some ways you can do so
Text Link
photo Link
<span class="text-link">
<span>
<a target="_blank" href=https://pikwizard.com/photo/abstract-financial-data-overlapping-warehouse/00ed5411bdcadd26c3f09805fbd71461/>PikWizard</a>
</span>
</span>
<span class="image-link">
<span
style="margin: 0 0 20px 0; display: inline-block; vertical-align: middle; width: 100%;"
>
<a
target="_blank"
href="https://pikwizard.com/photo/abstract-financial-data-overlapping-warehouse/00ed5411bdcadd26c3f09805fbd71461/"
style="text-decoration: none; font-size: 10px; margin: 0;"
>
<img src="https://pikwizard.com/pw/medium/00ed5411bdcadd26c3f09805fbd71461.jpg" style="margin: 0; width: 100%;" alt="" />
<p style="font-size: 12px; margin: 0;">PikWizard</p>
</a>
</span>
</span>
Free (free of charge)
Free for personal and commercial use.
Author: Authentic Images
Similar Free Stock Images

Premium


Premium

Premium

Premium


Premium


Premium


Premium


Premium


Premium


Premium


Premium


Premium


Premium


Premium


Premium

Premium


Premium


Premium


Premium


Premium

Premium


Premium


Premium

Premium


Premium


Explore More Free Stock Images