
- Home >
- Stock Photos >
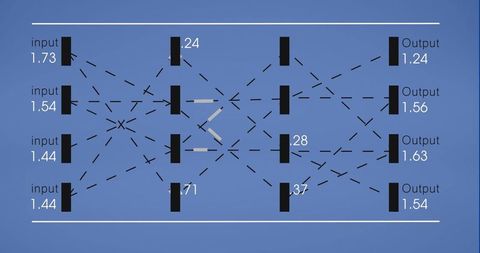
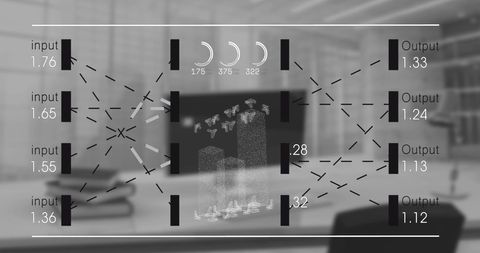
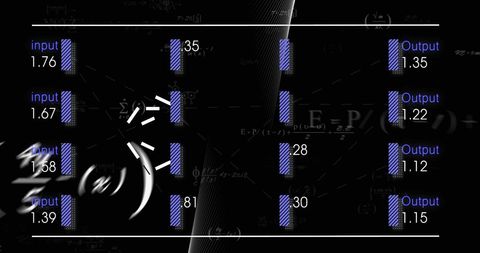
- Abstract Financial Data Processing Diagram with Outputs
Abstract Financial Data Processing Diagram with Outputs Image
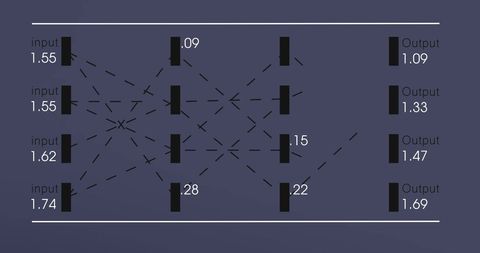
Visual representing processing of financial data with various inputs and outputs, suitable for illustrating concepts in financial technology, data analysis, and global business solutions. Useful for presentations on economic theories, analytical software development, or educational materials regarding digital financial networks.
Powered by 


downloads
Tags:
More
Credit Photo
If you would like to credit the Photo, here are some ways you can do so
Text Link
photo Link
<span class="text-link">
<span>
<a target="_blank" href=https://pikwizard.com/photo/abstract-financial-data-processing-diagram-with-outputs/b30467eafa6f1afbfd4ab3430bf2e461/>PikWizard</a>
</span>
</span>
<span class="image-link">
<span
style="margin: 0 0 20px 0; display: inline-block; vertical-align: middle; width: 100%;"
>
<a
target="_blank"
href="https://pikwizard.com/photo/abstract-financial-data-processing-diagram-with-outputs/b30467eafa6f1afbfd4ab3430bf2e461/"
style="text-decoration: none; font-size: 10px; margin: 0;"
>
<img src="https://pikwizard.com/pw/medium/b30467eafa6f1afbfd4ab3430bf2e461.jpg" style="margin: 0; width: 100%;" alt="" />
<p style="font-size: 12px; margin: 0;">PikWizard</p>
</a>
</span>
</span>
Free (free of charge)
Free for personal and commercial use.
Author: Awesome Content
Similar Free Stock Images

Premium


Premium


Premium


Premium


Premium


Premium

Premium


Premium

Premium


Premium


Premium


Premium


Premium


Premium


Premium


Premium


Premium


Premium


Premium


Premium


Premium

Premium

Premium


Premium


Premium


Explore More Free Stock Images