
- Home >
- Stock Photos >
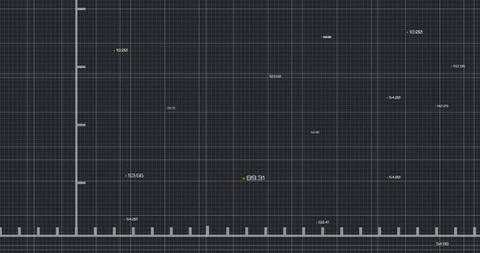
- Abstract Financial Data Processing on Black Background
Abstract Financial Data Processing on Black Background Image

This graphic presents a stylized view of financial data processing, arrayed against a pure black background. Its abstract representation makes it suitable for illustrating themes related to finance and business analytics. Ideal for use in presentations, financial reports, or marketing materials concerning data analytic capabilities and technological advancements in finance. Potential usages include discussions on data trends, global markets, or the future of fintech.
Powered by 


downloads
Tags:
More
Credit Photo
If you would like to credit the Photo, here are some ways you can do so
Text Link
photo Link
<span class="text-link">
<span>
<a target="_blank" href=https://pikwizard.com/photo/abstract-financial-data-processing-on-black-background/de68e953f3bb58199384a234513b59b6/>PikWizard</a>
</span>
</span>
<span class="image-link">
<span
style="margin: 0 0 20px 0; display: inline-block; vertical-align: middle; width: 100%;"
>
<a
target="_blank"
href="https://pikwizard.com/photo/abstract-financial-data-processing-on-black-background/de68e953f3bb58199384a234513b59b6/"
style="text-decoration: none; font-size: 10px; margin: 0;"
>
<img src="https://pikwizard.com/pw/medium/de68e953f3bb58199384a234513b59b6.jpg" style="margin: 0; width: 100%;" alt="" />
<p style="font-size: 12px; margin: 0;">PikWizard</p>
</a>
</span>
</span>
Free (free of charge)
Free for personal and commercial use.
Author: Authentic Images
Similar Free Stock Images

Premium


Premium


Premium


Premium


Premium


Premium

Premium


Premium


Premium

Premium

Premium

Premium


Premium


Premium


Premium

Premium

Premium


Premium


Premium


Premium


Premium


Premium


Premium


Premium


Premium

Explore More Free Stock Images