
- Home >
- Stock Photos >
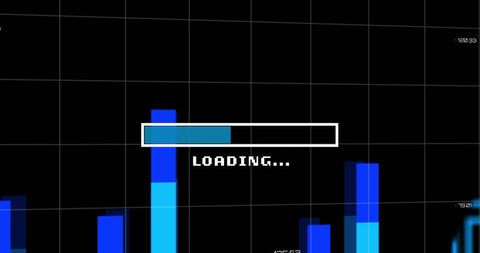
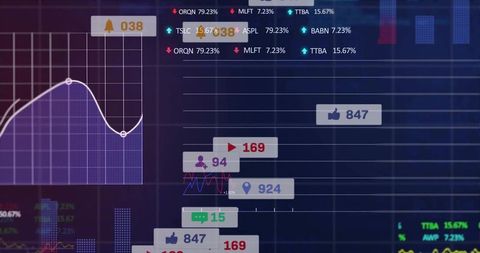
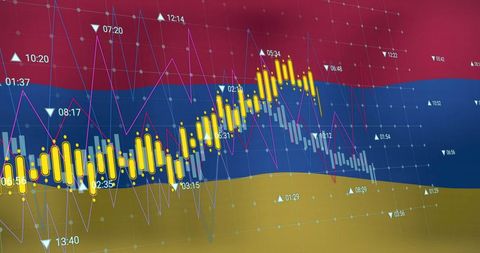
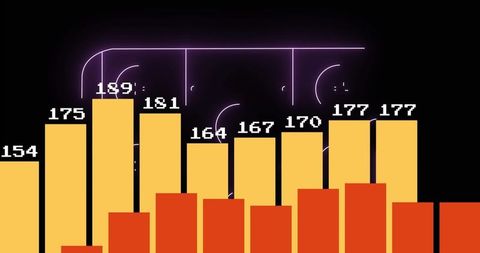
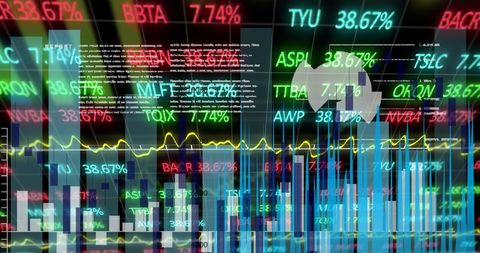
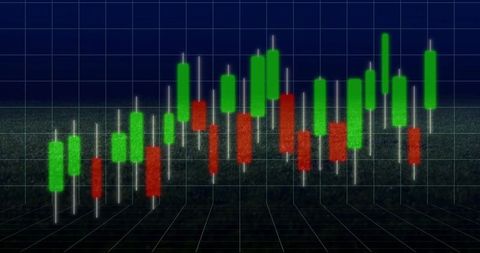
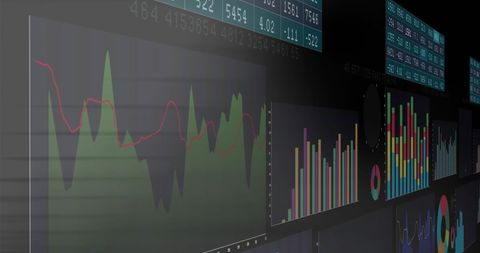
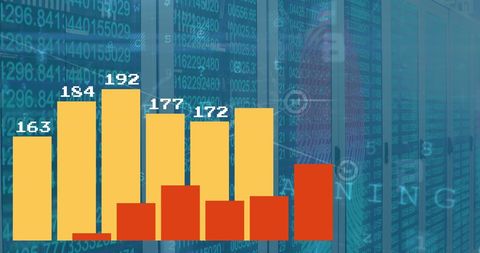
- Abstract Financial Data Processing with Graphs and Bar Figures
Abstract Financial Data Processing with Graphs and Bar Figures Image

Modern visualization depicting financial data with graphs and bar figures against a dark digital grid backdrop. Suitable for illustrating stock market trends, business analytics, and financial technology presentations. Useful in projects related to investment strategy and economic planning.
Powered by 


downloads
Tags:
More
Credit Photo
If you would like to credit the Photo, here are some ways you can do so
Text Link
photo Link
<span class="text-link">
<span>
<a target="_blank" href=https://pikwizard.com/photo/abstract-financial-data-processing-with-graphs-and-bar-figures/4e4f80b5323e638b74bd1862eeb4c1ab/>PikWizard</a>
</span>
</span>
<span class="image-link">
<span
style="margin: 0 0 20px 0; display: inline-block; vertical-align: middle; width: 100%;"
>
<a
target="_blank"
href="https://pikwizard.com/photo/abstract-financial-data-processing-with-graphs-and-bar-figures/4e4f80b5323e638b74bd1862eeb4c1ab/"
style="text-decoration: none; font-size: 10px; margin: 0;"
>
<img src="https://pikwizard.com/pw/medium/4e4f80b5323e638b74bd1862eeb4c1ab.jpg" style="margin: 0; width: 100%;" alt="" />
<p style="font-size: 12px; margin: 0;">PikWizard</p>
</a>
</span>
</span>
Free (free of charge)
Free for personal and commercial use.
Author: People Creations
Similar Free Stock Images

Premium


Premium


Premium


Premium


Premium

Premium


Premium


Premium

Premium


Premium


Premium


Premium

Premium

Premium

Premium


Premium


Premium


Premium


Premium

Premium

Premium

Premium


Premium


Premium


Premium


Explore More Free Stock Images