
- Home >
- Stock Photos >
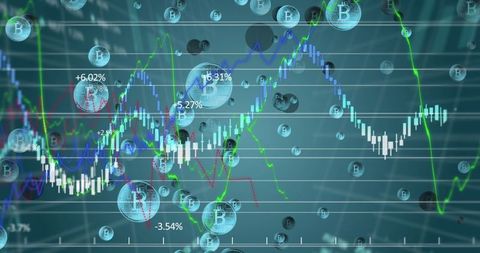
- Abstract Financial Data Processing with Graphs and Charts Overlay
Abstract Financial Data Processing with Graphs and Charts Overlay Image

This image illustrates advanced financial data processing with complex graphs and charts. The digital interface suggests a modern technological environment focused on finance, investment, and market analysis. This image is ideal for financial services, stock market updates, investment platforms, and articles related to economic trends and trading strategies. It can effectively convey the concept of dynamic market environments and informed decision-making.
Powered by 


downloads
Tags:
More
Credit Photo
If you would like to credit the Photo, here are some ways you can do so
Text Link
photo Link
<span class="text-link">
<span>
<a target="_blank" href=https://pikwizard.com/photo/abstract-financial-data-processing-with-graphs-and-charts-overlay/45fc0f4528fec87699a8eea1463662fd/>PikWizard</a>
</span>
</span>
<span class="image-link">
<span
style="margin: 0 0 20px 0; display: inline-block; vertical-align: middle; width: 100%;"
>
<a
target="_blank"
href="https://pikwizard.com/photo/abstract-financial-data-processing-with-graphs-and-charts-overlay/45fc0f4528fec87699a8eea1463662fd/"
style="text-decoration: none; font-size: 10px; margin: 0;"
>
<img src="https://pikwizard.com/pw/medium/45fc0f4528fec87699a8eea1463662fd.jpg" style="margin: 0; width: 100%;" alt="" />
<p style="font-size: 12px; margin: 0;">PikWizard</p>
</a>
</span>
</span>
Free (free of charge)
Free for personal and commercial use.
Author: People Creations
Similar Free Stock Images

Premium


Premium


Premium


Premium


Premium


Premium


Premium


Premium


Premium


Premium


Premium

Premium


Premium

Premium


Premium


Premium

Premium


Premium

Premium

Premium


Premium

Premium


Premium


Premium


Premium


Explore More Free Stock Images