- Home >
- Stock Photos >
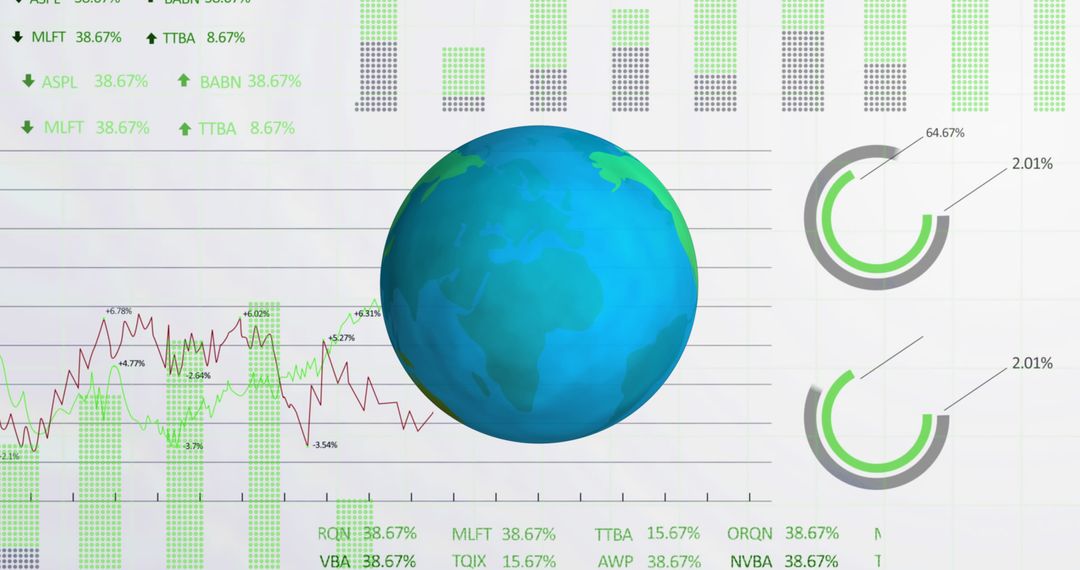
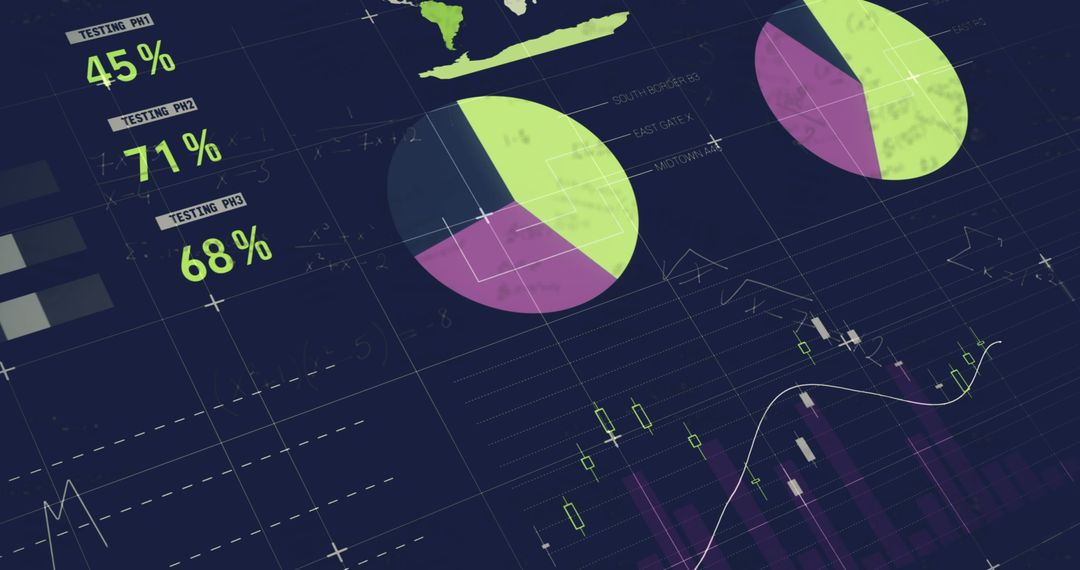
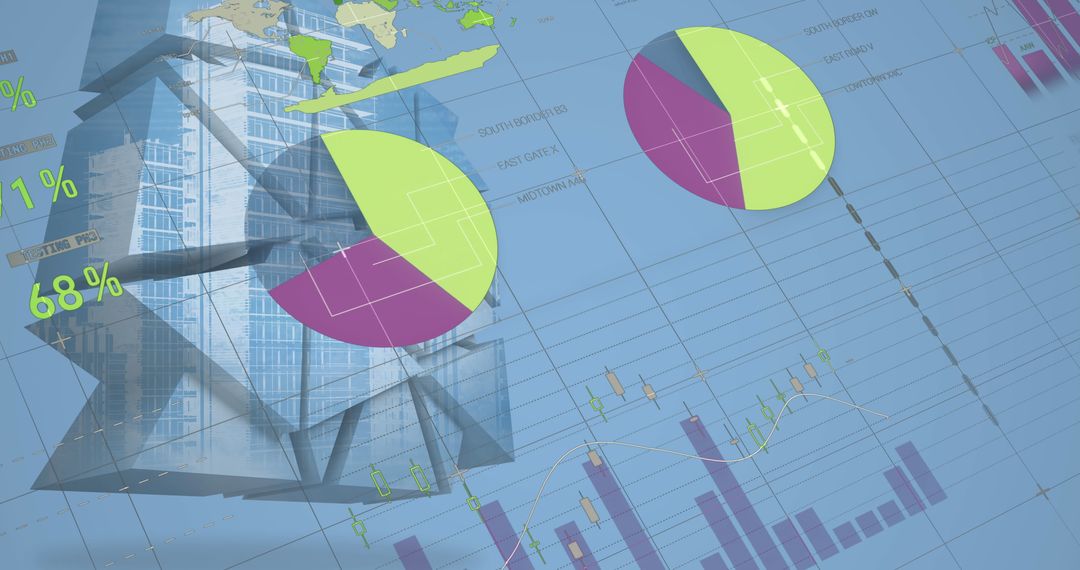
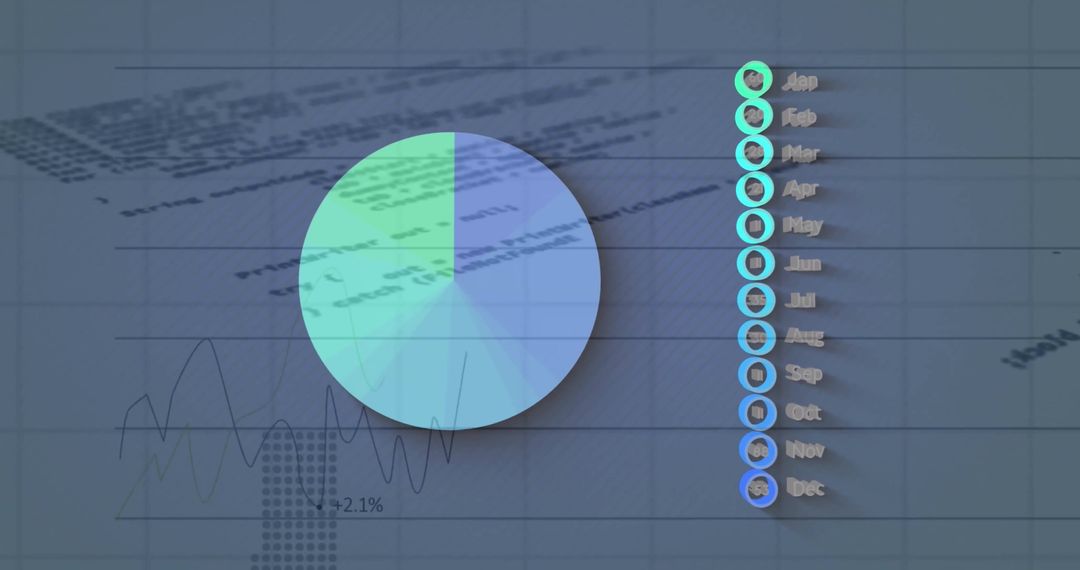
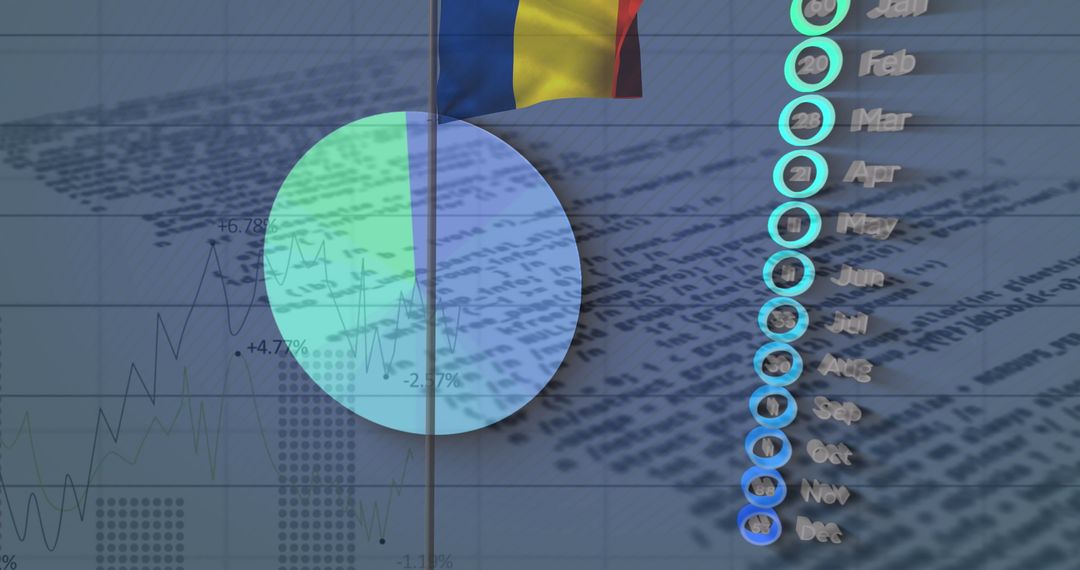
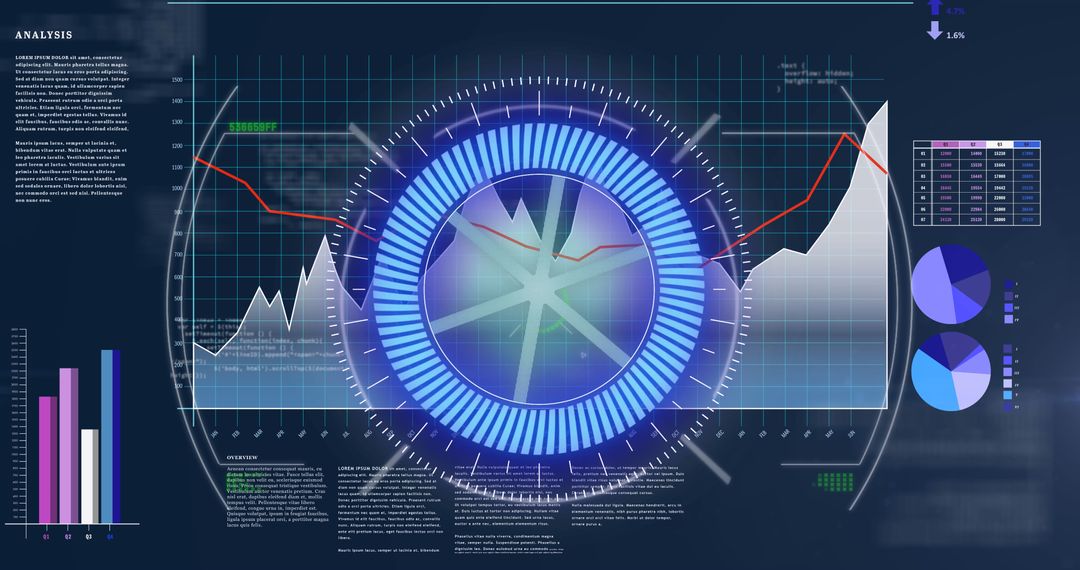
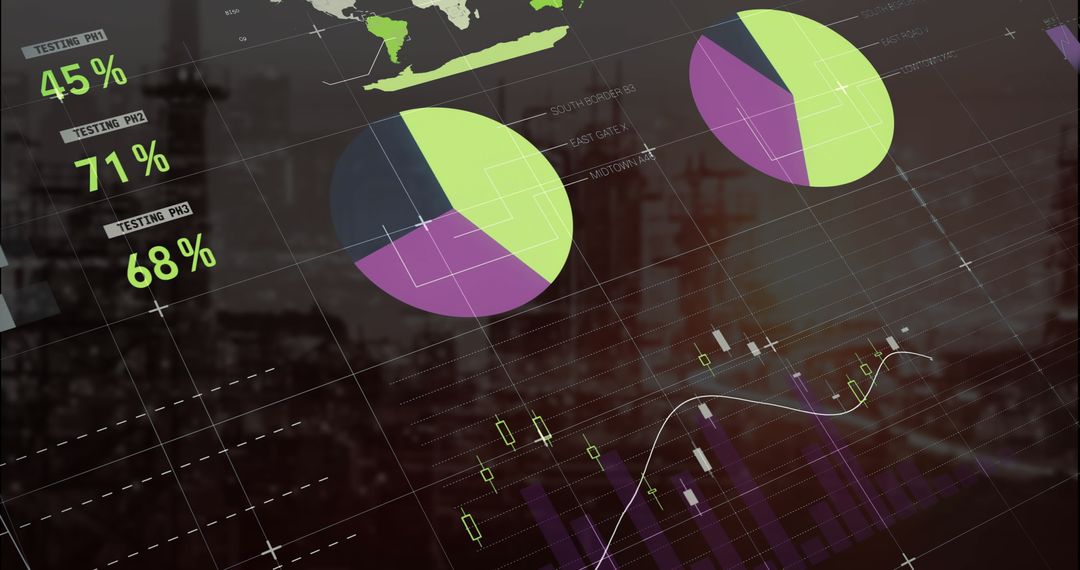
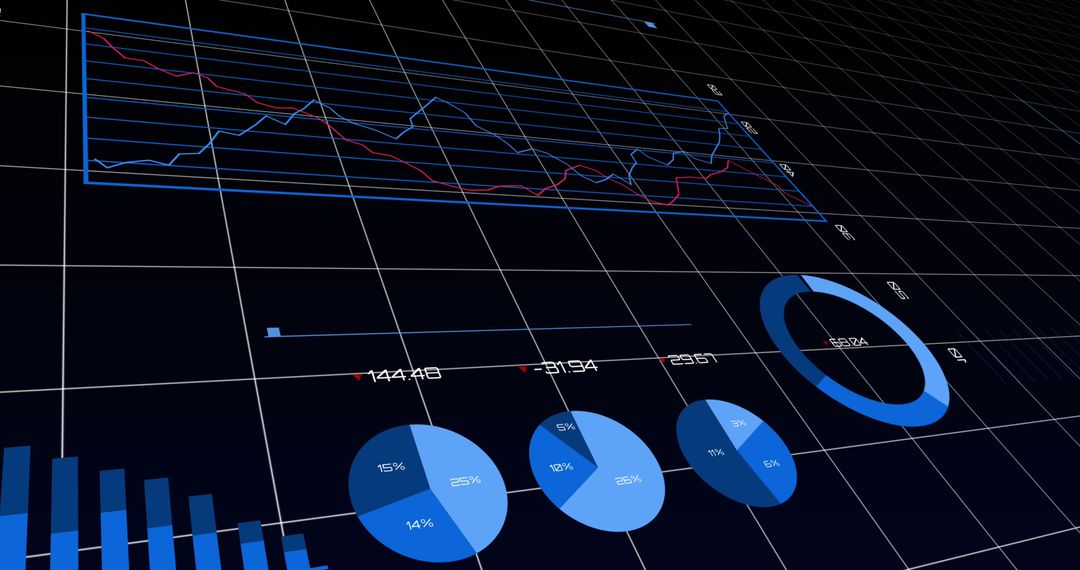
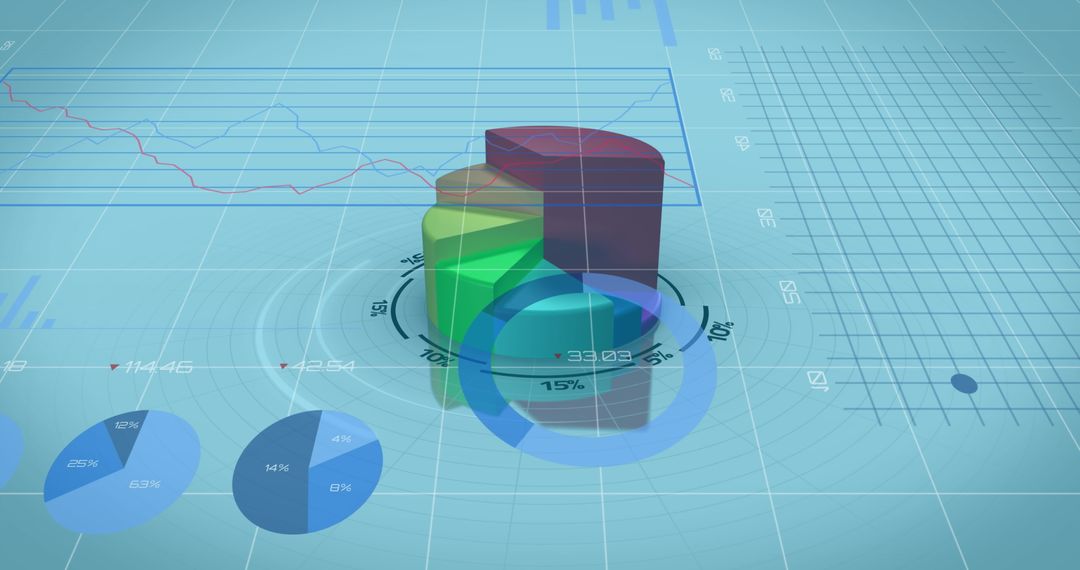
- Abstract Financial Data Processing with Pie Chart and Calendar
Abstract Financial Data Processing with Pie Chart and Calendar Image
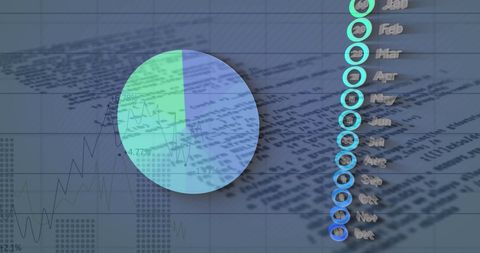
Blends financial data with abstract graphics focusing on pie charts and a digital calendar representing months. Illustrates data analysis, economic trends, and the interface of business and technology concepts. Great for articles or presentations covering financial technology, market analysis, and business reporting.
Powered by 


2
downloads
downloads
Tags:
More
Credit Photo
If you would like to credit the Photo, here are some ways you can do so
Text Link
photo Link
<span class="text-link">
<span>
<a target="_blank" href=https://pikwizard.com/photo/abstract-financial-data-processing-with-pie-chart-and-calendar/4be6014179164881c9d3e83bed43ca25/>PikWizard</a>
</span>
</span>
<span class="image-link">
<span
style="margin: 0 0 20px 0; display: inline-block; vertical-align: middle; width: 100%;"
>
<a
target="_blank"
href="https://pikwizard.com/photo/abstract-financial-data-processing-with-pie-chart-and-calendar/4be6014179164881c9d3e83bed43ca25/"
style="text-decoration: none; font-size: 10px; margin: 0;"
>
<img src="https://pikwizard.com/pw/medium/4be6014179164881c9d3e83bed43ca25.jpg" style="margin: 0; width: 100%;" alt="" />
<p style="font-size: 12px; margin: 0;">PikWizard</p>
</a>
</span>
</span>
Free (free of charge)
Free for personal and commercial use.
Author: People Creations
Similar Free Stock Images

Premium


Premium


Premium


Premium


Premium


Premium


Premium


Premium


Premium


Premium


Premium


Premium


Premium


Premium


Premium


Premium


Premium


Premium


Premium


Premium


Premium


Premium


Premium


Premium