
- Home >
- Stock Photos >
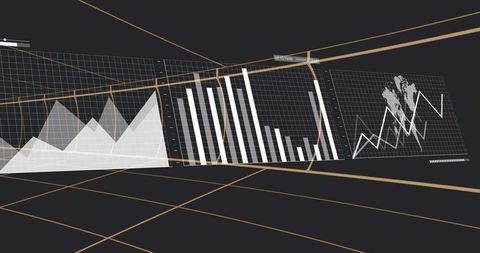
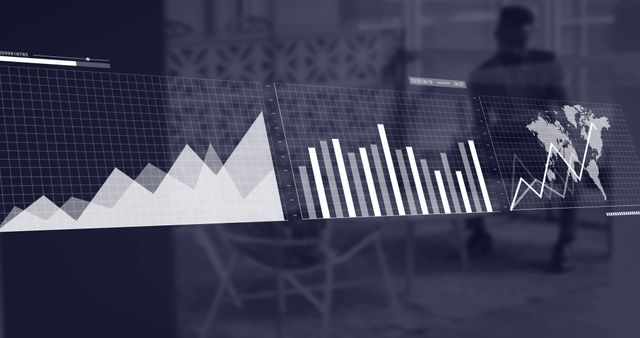
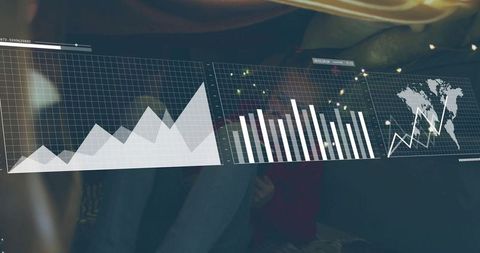
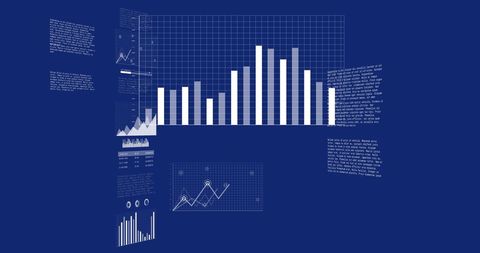
- Abstract Financial Data Processing With World Map and Charts
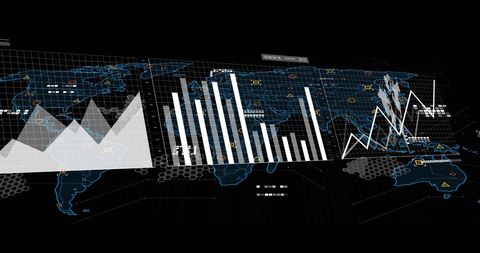
Abstract Financial Data Processing With World Map and Charts Image
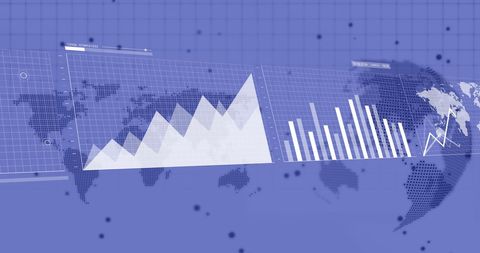
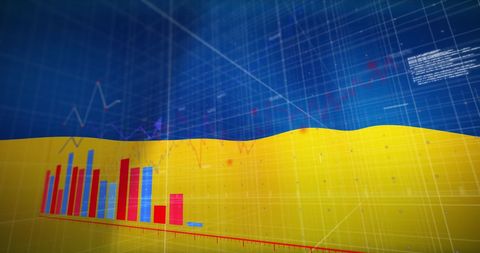
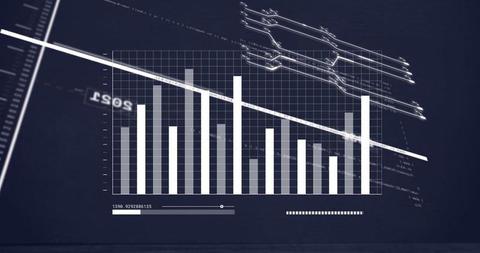
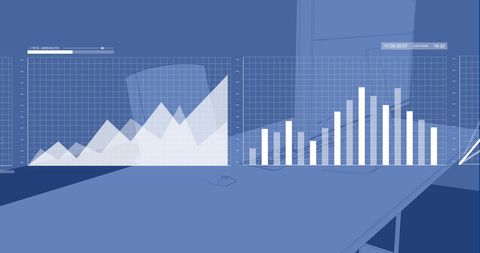
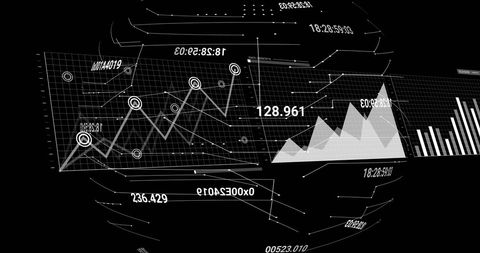
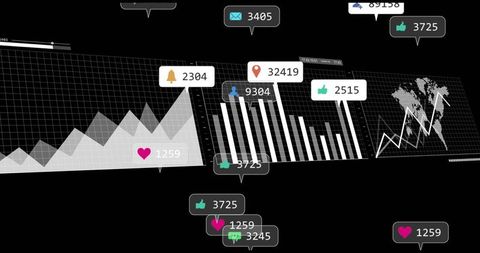
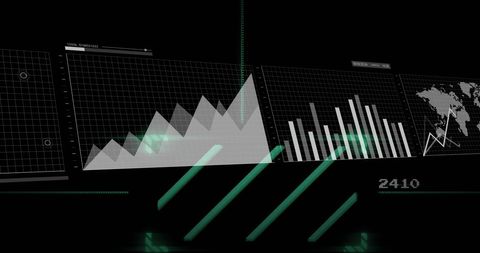
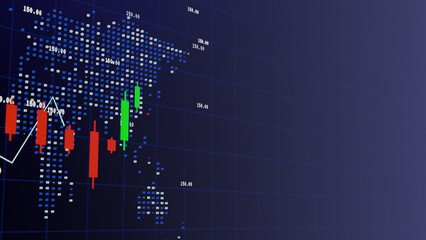
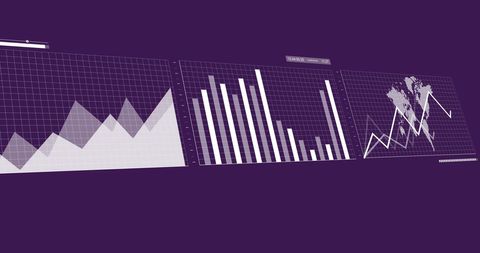
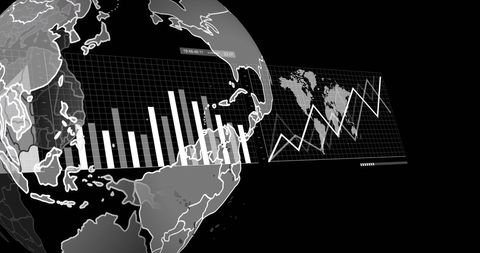
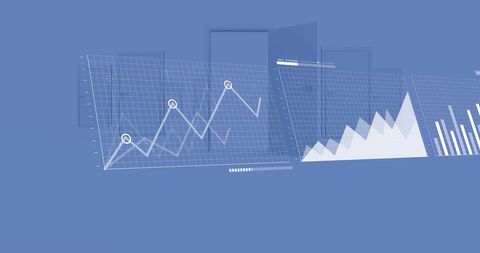
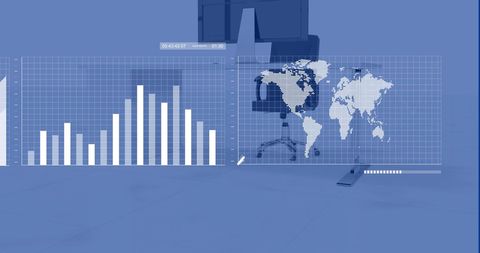
Geared for business platforms, this visual captures the intersection of global finance and technology. Emphasizing financial data juxtaposed with a world map, it employs charts to symbolize global analytics. Ideal for use in financial presentations, business analytics discussions, web design on financial service sites, or conference materials emphasizing business growth and global connectivity.
Powered by 


downloads
Tags:
More
Credit Photo
If you would like to credit the Photo, here are some ways you can do so
Text Link
photo Link
<span class="text-link">
<span>
<a target="_blank" href=https://pikwizard.com/photo/abstract-financial-data-processing-with-world-map-and-charts/e98ff85c46d0d6f2813c8d3772d4b980/>PikWizard</a>
</span>
</span>
<span class="image-link">
<span
style="margin: 0 0 20px 0; display: inline-block; vertical-align: middle; width: 100%;"
>
<a
target="_blank"
href="https://pikwizard.com/photo/abstract-financial-data-processing-with-world-map-and-charts/e98ff85c46d0d6f2813c8d3772d4b980/"
style="text-decoration: none; font-size: 10px; margin: 0;"
>
<img src="https://pikwizard.com/pw/medium/e98ff85c46d0d6f2813c8d3772d4b980.jpg" style="margin: 0; width: 100%;" alt="" />
<p style="font-size: 12px; margin: 0;">PikWizard</p>
</a>
</span>
</span>
Free (free of charge)
Free for personal and commercial use.
Author: Authentic Images
Similar Free Stock Images

Premium

Premium

Premium


Premium


Premium

Premium


Premium


Premium

Premium


Premium


Premium


Premium


Premium


Premium


Premium

Premium


Premium


Premium

Premium


Premium

Premium


Premium


Premium


Premium


Premium


Explore More Free Stock Images