
- Home >
- Stock Photos >
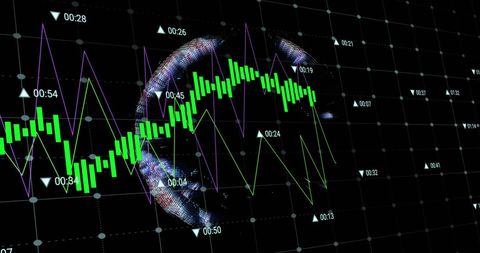
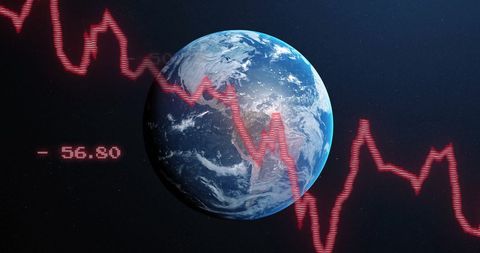
- Abstract Financial Data Streaming Over World Map Visualization
Abstract Financial Data Streaming Over World Map Visualization Image

Eye-catching depiction of financial data trends merging with global connections, suitable for articles, blog posts, or presentations on finance, technology trends, and global business strategy advancements.
Powered by 


downloads
Tags:
More
Credit Photo
If you would like to credit the Photo, here are some ways you can do so
Text Link
photo Link
<span class="text-link">
<span>
<a target="_blank" href=https://pikwizard.com/photo/abstract-financial-data-streaming-over-world-map-visualization/3badef8ad3787592ad14ba4f31702eab/>PikWizard</a>
</span>
</span>
<span class="image-link">
<span
style="margin: 0 0 20px 0; display: inline-block; vertical-align: middle; width: 100%;"
>
<a
target="_blank"
href="https://pikwizard.com/photo/abstract-financial-data-streaming-over-world-map-visualization/3badef8ad3787592ad14ba4f31702eab/"
style="text-decoration: none; font-size: 10px; margin: 0;"
>
<img src="https://pikwizard.com/pw/medium/3badef8ad3787592ad14ba4f31702eab.jpg" style="margin: 0; width: 100%;" alt="" />
<p style="font-size: 12px; margin: 0;">PikWizard</p>
</a>
</span>
</span>
Free (free of charge)
Free for personal and commercial use.
Author: Creative Art
Similar Free Stock Images

Premium


Premium


Premium


Premium


Premium


Premium

Premium


Premium


Premium


Premium


Premium


Premium


Premium

Premium

Premium


Premium


Premium


Premium


Premium


Premium


Premium


Premium


Premium


Premium


Premium


Explore More Free Stock Images