- Home >
- Stock Photos >
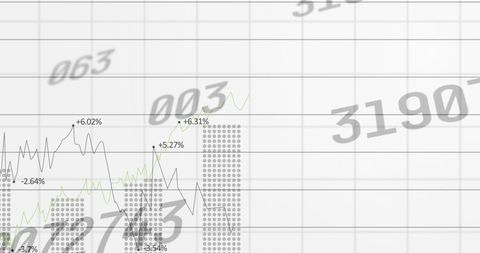
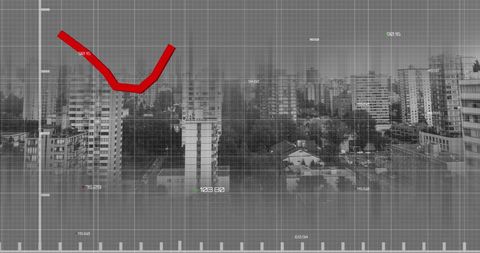
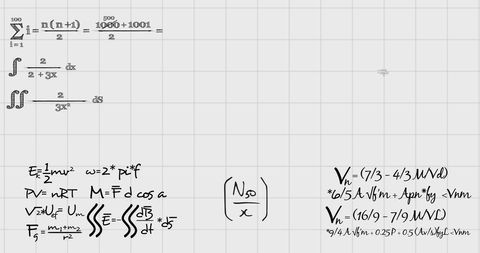
- Abstract Financial Data Virtual Interface on Grid Background
Abstract Financial Data Virtual Interface on Grid Background Image

This abstract visualization showcases blurred and sharp symbols on a grid background, representing financial data and digital trust interfaces. Useful for presentations or publications on modern data processing in finance and technology-driven industries. Excellent asset for illustrating concepts such as data technology adaptation, virtual stock market transactions, or evolving global financial muscles.

downloads
Tags:
More
Credit Photo
If you would like to credit the Photo, here are some ways you can do so
Text Link
photo Link
<span class="text-link">
<span>
<a target="_blank" href=https://pikwizard.com/photo/abstract-financial-data-virtual-interface-on-grid-background/d11988ec5d21f9c31cd0927597fba593/>PikWizard</a>
</span>
</span>
<span class="image-link">
<span
style="margin: 0 0 20px 0; display: inline-block; vertical-align: middle; width: 100%;"
>
<a
target="_blank"
href="https://pikwizard.com/photo/abstract-financial-data-virtual-interface-on-grid-background/d11988ec5d21f9c31cd0927597fba593/"
style="text-decoration: none; font-size: 10px; margin: 0;"
>
<img src="https://pikwizard.com/pw/medium/d11988ec5d21f9c31cd0927597fba593.jpg" style="margin: 0; width: 100%;" alt="" />
<p style="font-size: 12px; margin: 0;">PikWizard</p>
</a>
</span>
</span>
Free (free of charge)
Free for personal and commercial use.
Author: Creative Art