
- Home >
- Stock Photos >
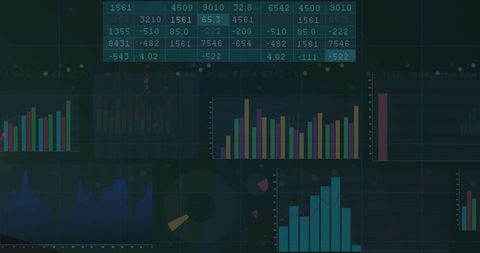
- Abstract Financial Data Visualization and Statistics
Abstract Financial Data Visualization and Statistics Image

Abstract representation of financial data visualization with overlaying charts and graphs provides a sense of analytics and statistics. Useful resource for presentations, websites, and reports related to finance, economic analysis, or data-driven performance metrics.
Powered by 


downloads
Tags:
More
Credit Photo
If you would like to credit the Photo, here are some ways you can do so
Text Link
photo Link
<span class="text-link">
<span>
<a target="_blank" href=https://pikwizard.com/photo/abstract-financial-data-visualization-and-statistics/af546111e6997d32bbde0c3f1d7f76c1/>PikWizard</a>
</span>
</span>
<span class="image-link">
<span
style="margin: 0 0 20px 0; display: inline-block; vertical-align: middle; width: 100%;"
>
<a
target="_blank"
href="https://pikwizard.com/photo/abstract-financial-data-visualization-and-statistics/af546111e6997d32bbde0c3f1d7f76c1/"
style="text-decoration: none; font-size: 10px; margin: 0;"
>
<img src="https://pikwizard.com/pw/medium/af546111e6997d32bbde0c3f1d7f76c1.jpg" style="margin: 0; width: 100%;" alt="" />
<p style="font-size: 12px; margin: 0;">PikWizard</p>
</a>
</span>
</span>
Free (free of charge)
Free for personal and commercial use.
Author: Awesome Content
Similar Free Stock Images

Premium


Premium


Premium

Premium


Premium


Premium

Premium
Premium


Premium


Premium

Premium


Premium


Premium


Premium

Premium

Premium


Premium


Premium


Premium


Premium


Premium


Premium


Premium


Premium


Premium

Explore More Free Stock Images