- Home >
- Stock Photos >
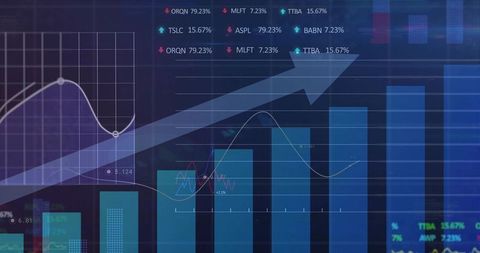
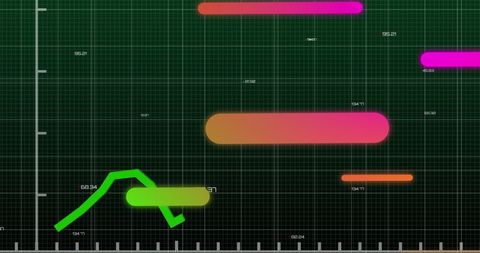
- Abstract Financial Data Visualization and Stock Market Analysis
Abstract Financial Data Visualization and Stock Market Analysis Image

Colorful bars moving over graphs and stock board symbolize technological advancement and data management in finance. Representing concepts of trading and digital reporting, it is ideal for illustrating economic trends, finance articles, data science materials, or tech-savvy business branding. Useful in digital marketing for finance or tech businesses focusing on analysis and growth.
Powered by  - Get 15% off with code: PIKWIZARD15


4
downloads
downloads
Tags:
More
Credit Photo
If you would like to credit the Photo, here are some ways you can do so
Text Link
photo Link
<span class="text-link">
<span>
<a target="_blank" href=https://pikwizard.com/photo/abstract-financial-data-visualization-and-stock-market-analysis/2924127e05a19339ce037bd476f8d840/>PikWizard</a>
</span>
</span>
<span class="image-link">
<span
style="margin: 0 0 20px 0; display: inline-block; vertical-align: middle; width: 100%;"
>
<a
target="_blank"
href="https://pikwizard.com/photo/abstract-financial-data-visualization-and-stock-market-analysis/2924127e05a19339ce037bd476f8d840/"
style="text-decoration: none; font-size: 10px; margin: 0;"
>
<img src="https://pikwizard.com/pw/medium/2924127e05a19339ce037bd476f8d840.jpg" style="margin: 0; width: 100%;" alt="" />
<p style="font-size: 12px; margin: 0;">PikWizard</p>
</a>
</span>
</span>
Free (free of charge)
Free for personal and commercial use.
Author: Creative Art
Similar Free Stock Images
Loading...

Premium


Premium


Premium


Premium


Premium


Premium


Premium


Premium

Premium


Premium


Premium


Premium


Premium


Premium


Premium


Premium


Premium


Premium


Premium

Premium

Premium


Premium


Premium


Premium

Premium