
- Home >
- Stock Photos >
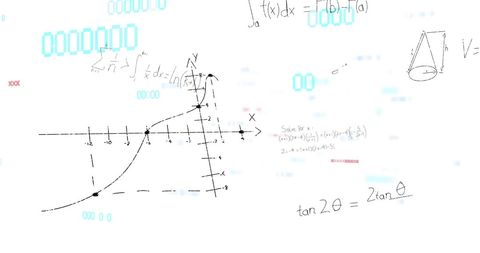
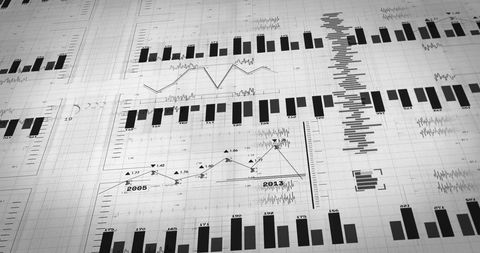
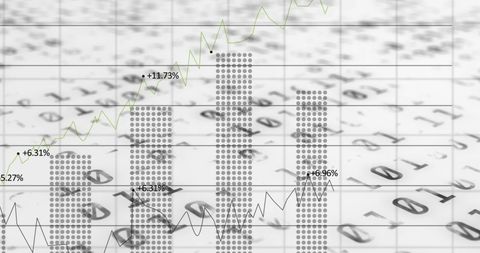
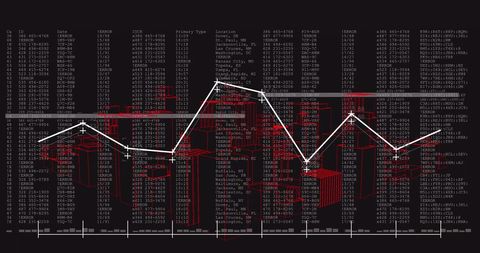
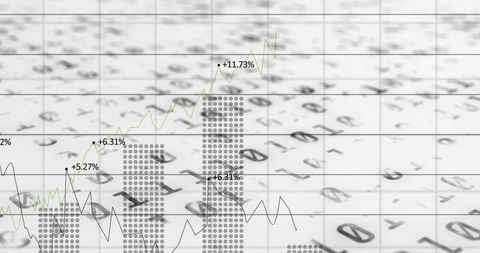
- Abstract Financial Data Visualization Background
Abstract Financial Data Visualization Background Image

Dynamic abstract illustration representing financial data processing. Combines various graphic elements like charts and numbers symbolizing complex business analytics and market trends. Ideal for use in presentations, corporate reports, financial services marketing, and tech-forward business contexts.
Powered by  - Get 15% off with code: PIKWIZARD15


downloads
Tags:
More
Credit Photo
If you would like to credit the Photo, here are some ways you can do so
Text Link
photo Link
<span class="text-link">
<span>
<a target="_blank" href=https://pikwizard.com/photo/abstract-financial-data-visualization-background/ab703ca0bb60b835b9e98ceebfe93b94/>PikWizard</a>
</span>
</span>
<span class="image-link">
<span
style="margin: 0 0 20px 0; display: inline-block; vertical-align: middle; width: 100%;"
>
<a
target="_blank"
href="https://pikwizard.com/photo/abstract-financial-data-visualization-background/ab703ca0bb60b835b9e98ceebfe93b94/"
style="text-decoration: none; font-size: 10px; margin: 0;"
>
<img src="https://pikwizard.com/pw/medium/ab703ca0bb60b835b9e98ceebfe93b94.jpg" style="margin: 0; width: 100%;" alt="" />
<p style="font-size: 12px; margin: 0;">PikWizard</p>
</a>
</span>
</span>
Free (free of charge)
Free for personal and commercial use.
Author: People Creations
Similar Free Stock Images

Premium


Premium

Premium


Premium

Premium


Premium


Premium

Premium

Premium

Premium


Premium


Premium


Premium


Premium


Premium


Premium


Premium

Premium

Premium


Premium

Premium

Premium


Premium


Premium


Premium


Explore More Free Stock Images