- Home >
- Stock Photos >
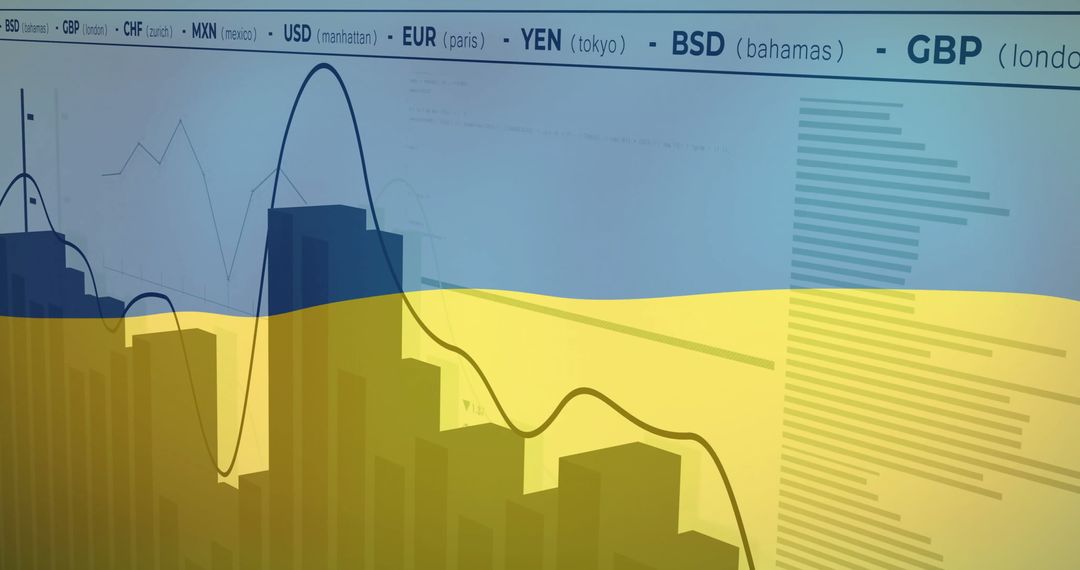
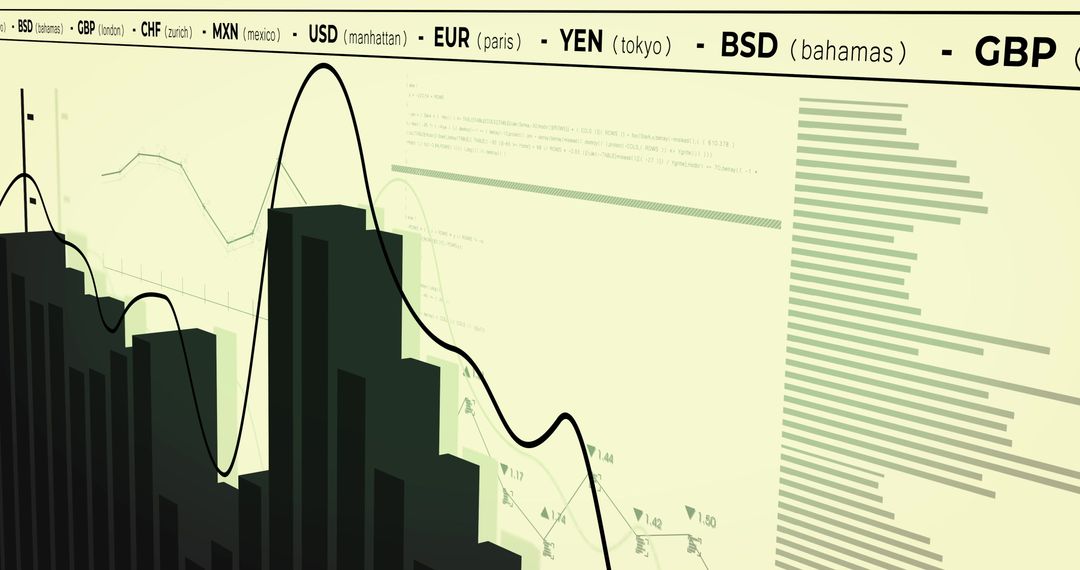
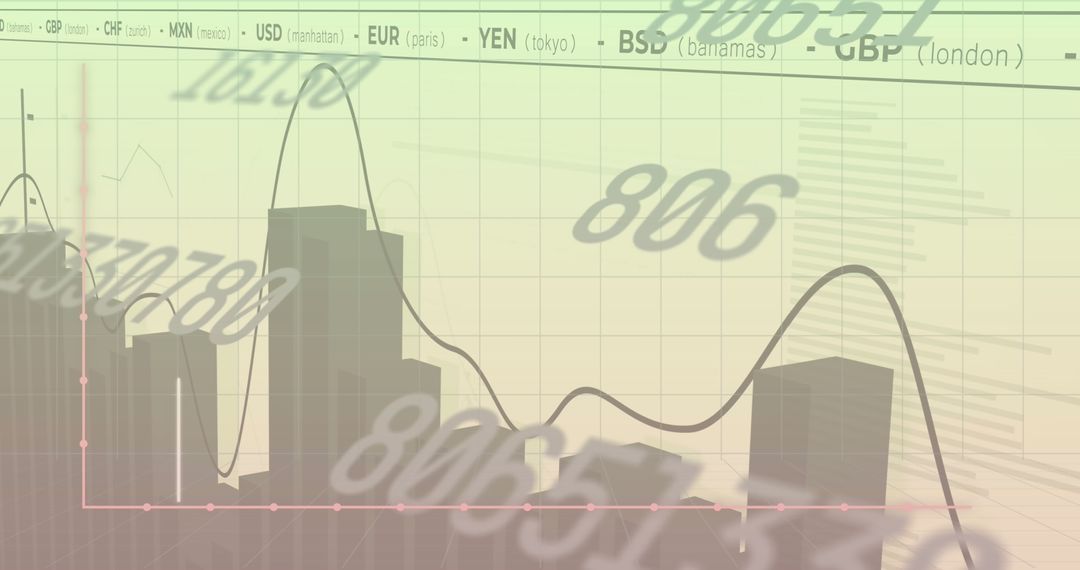
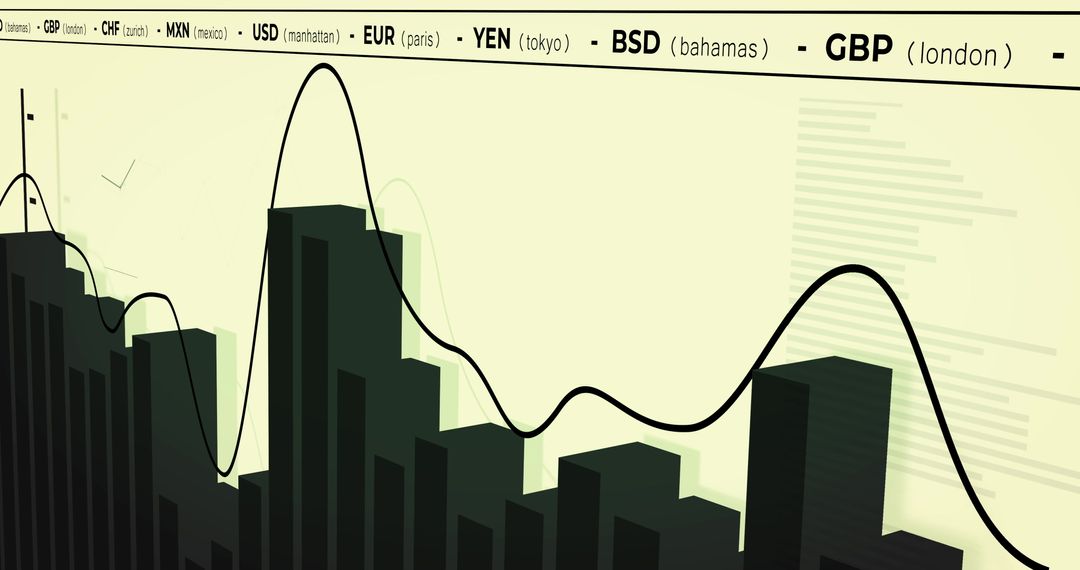
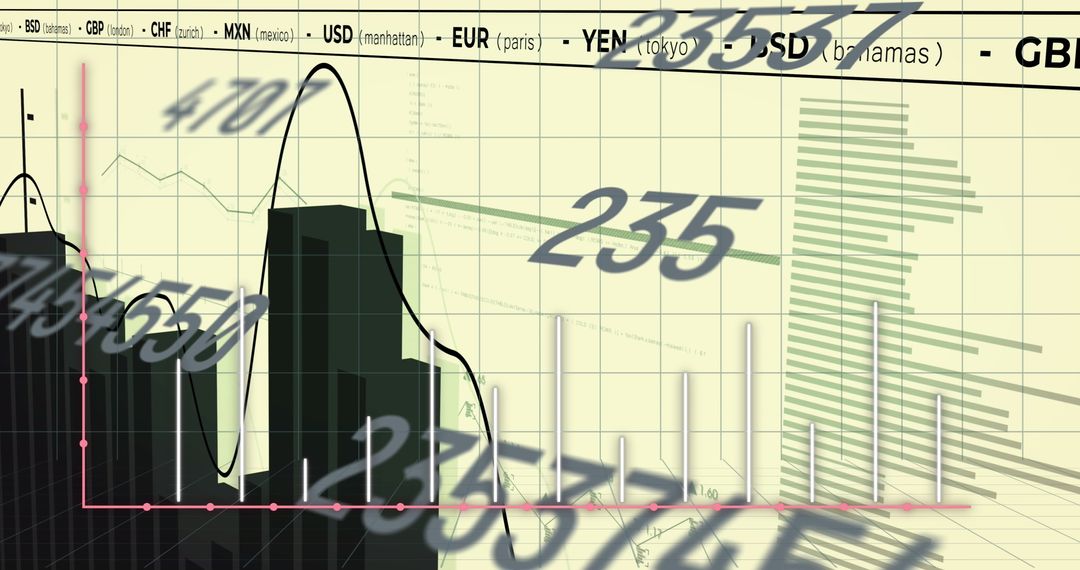
- Abstract Financial Data Visualization in Yellow Tones
Abstract Financial Data Visualization in Yellow Tones Image

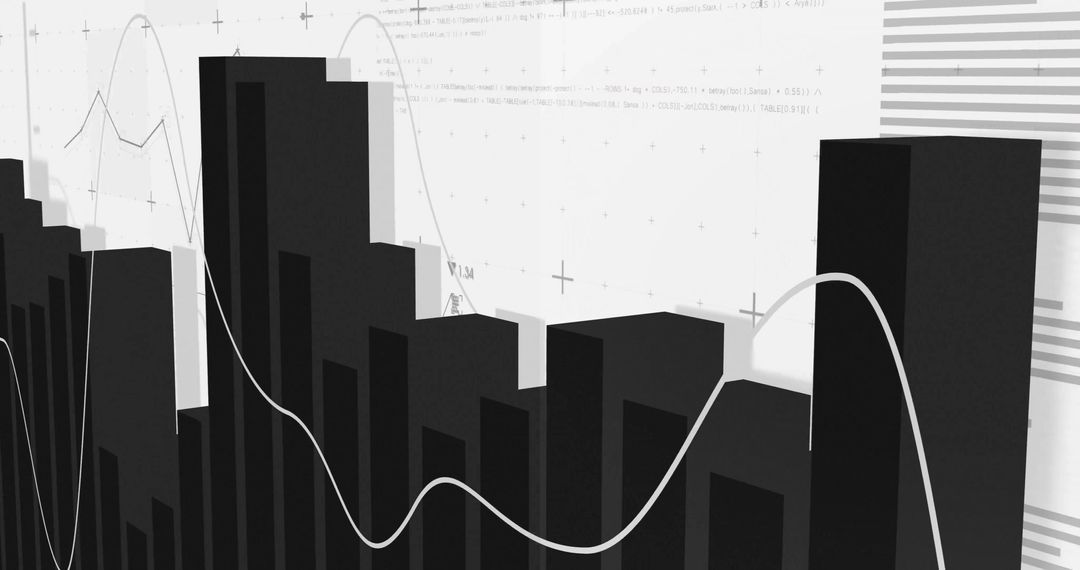
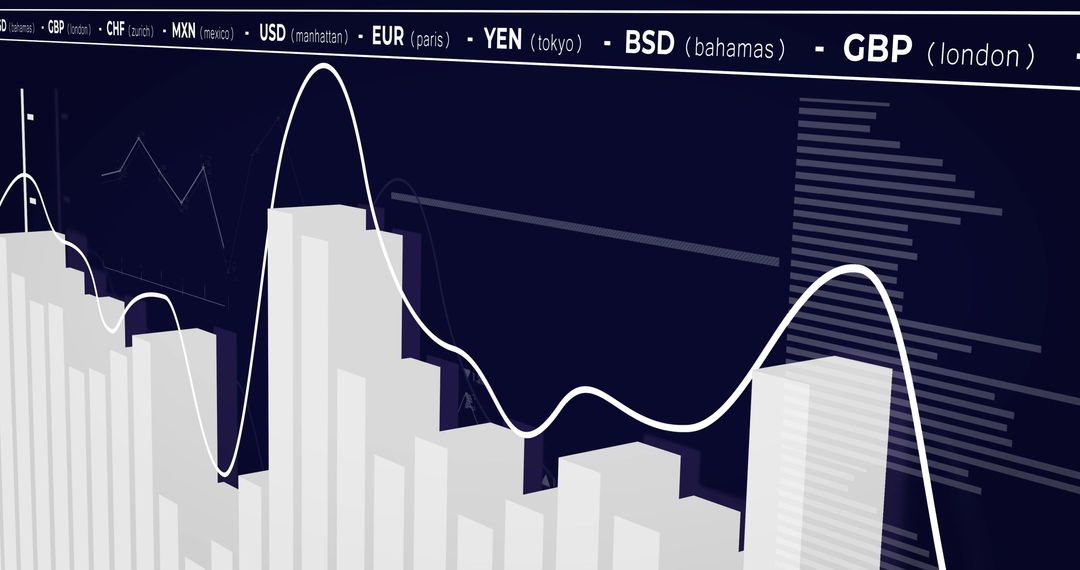
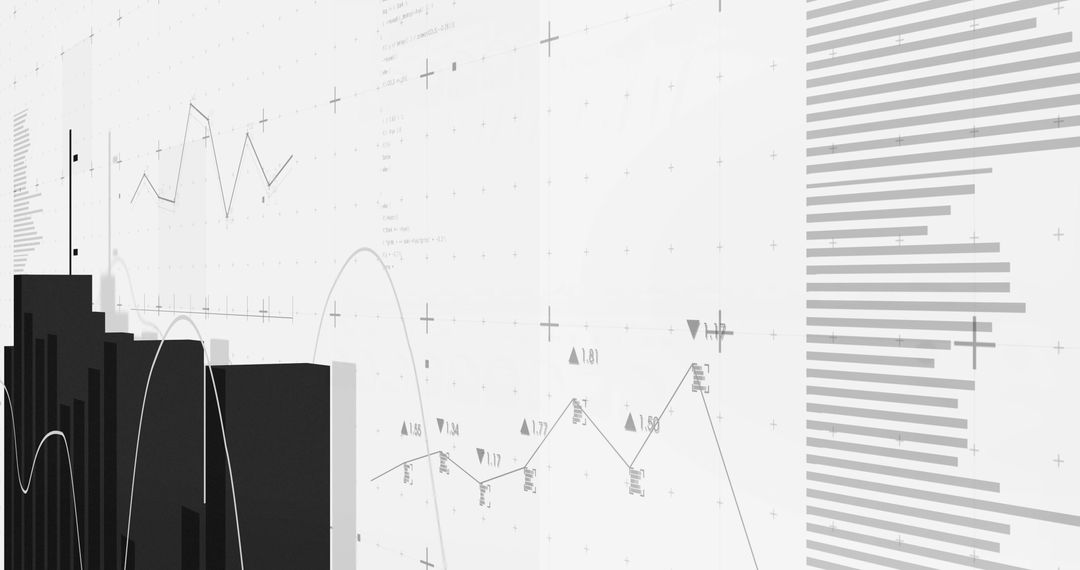
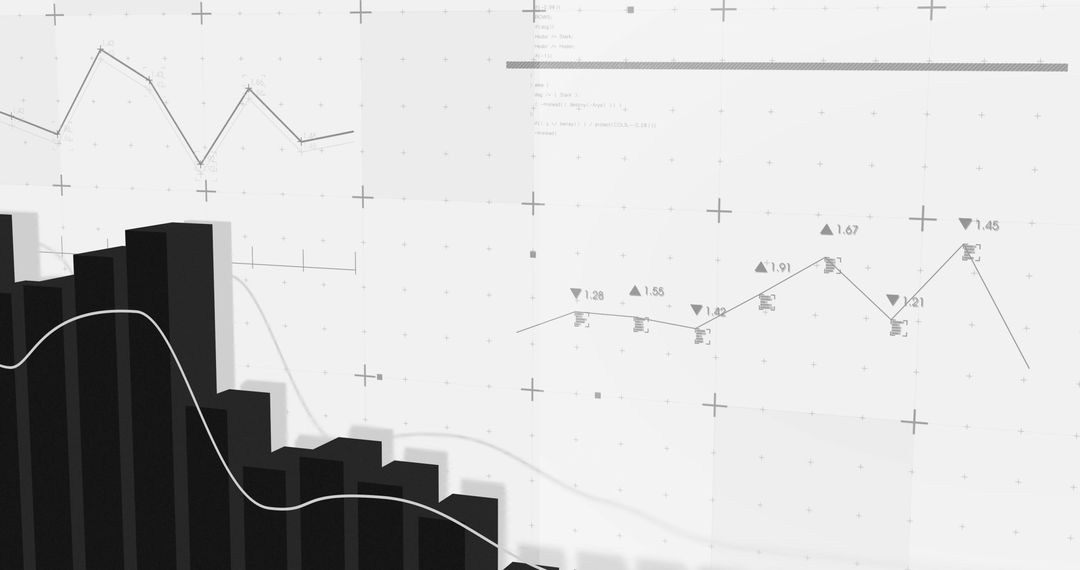
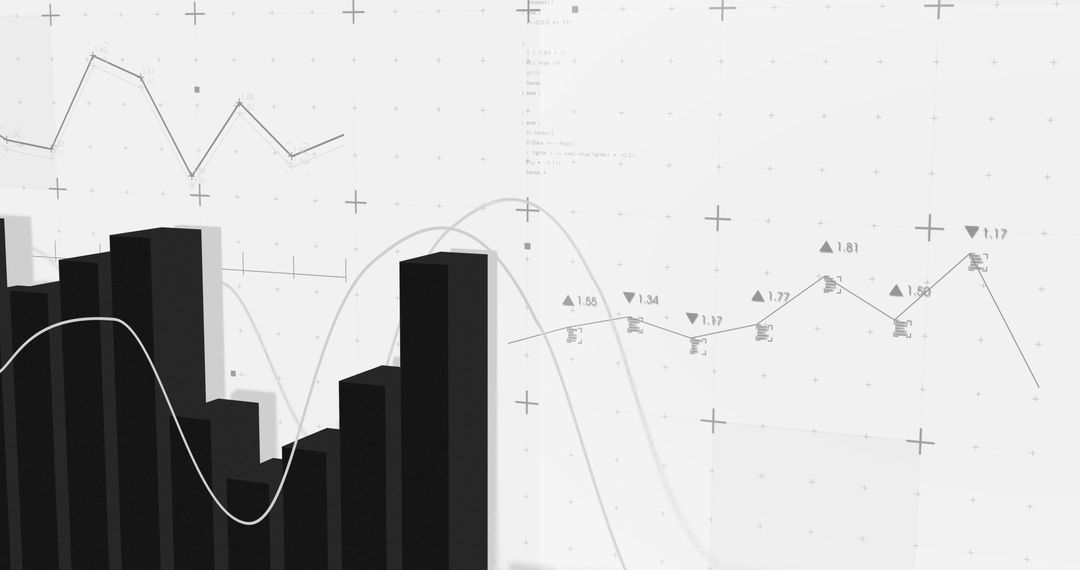
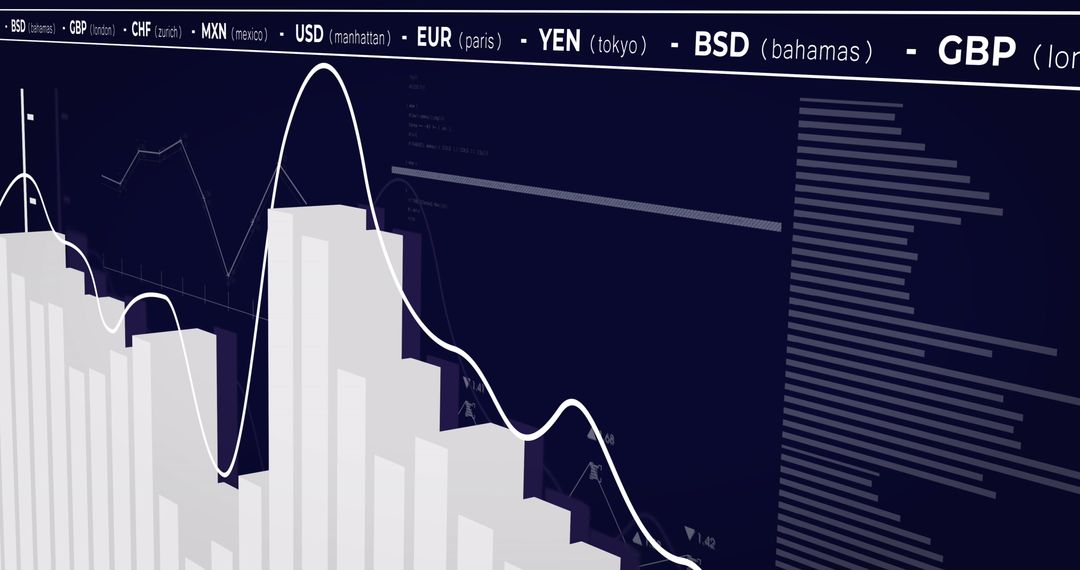
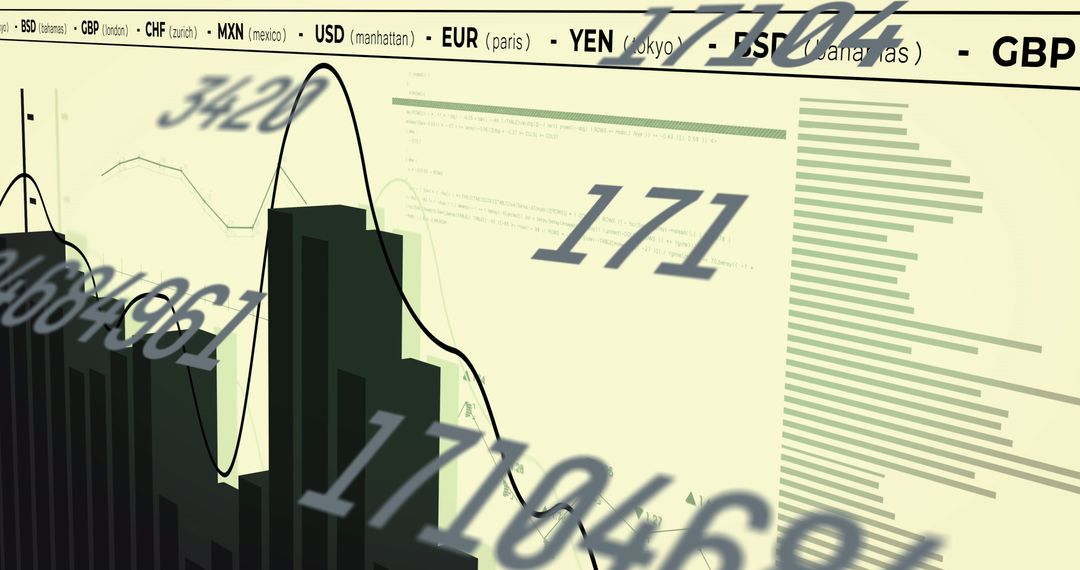
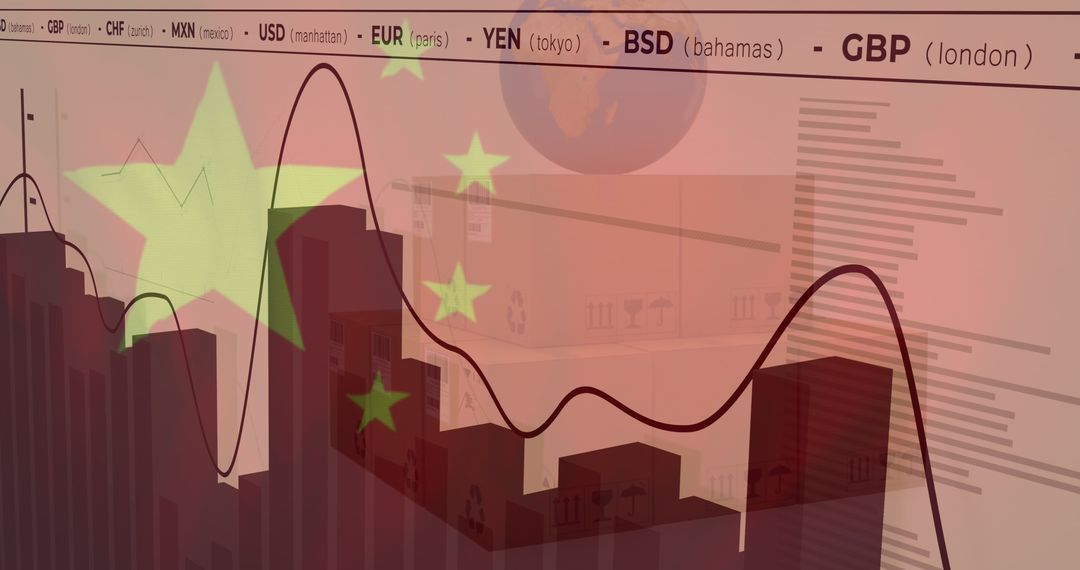
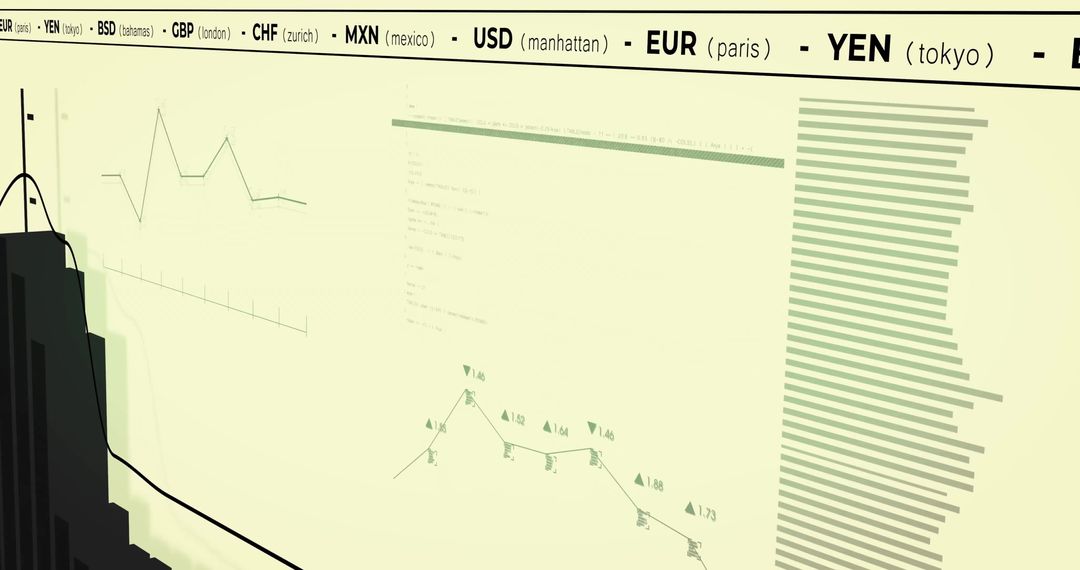
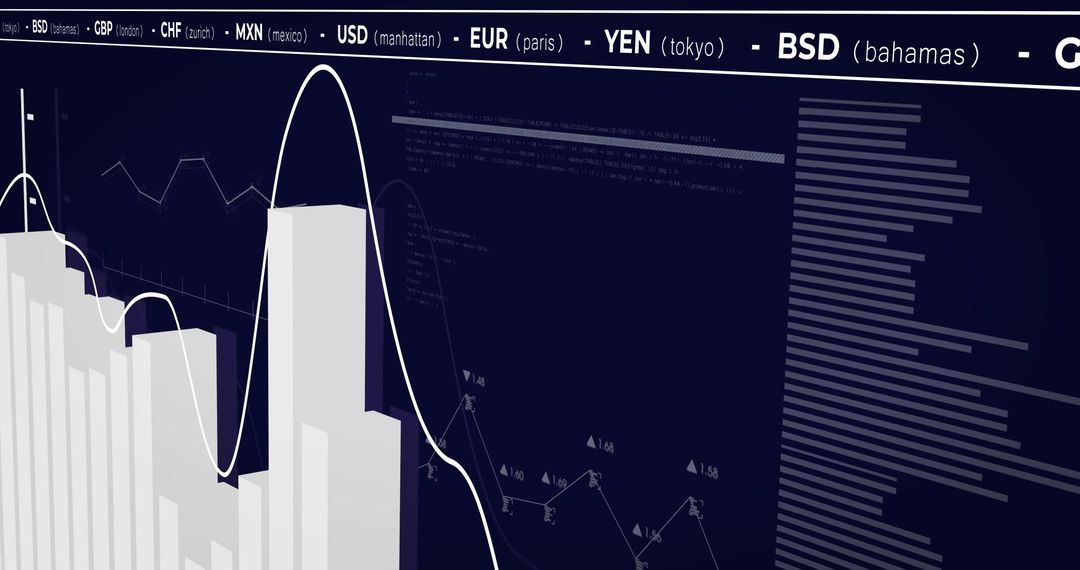
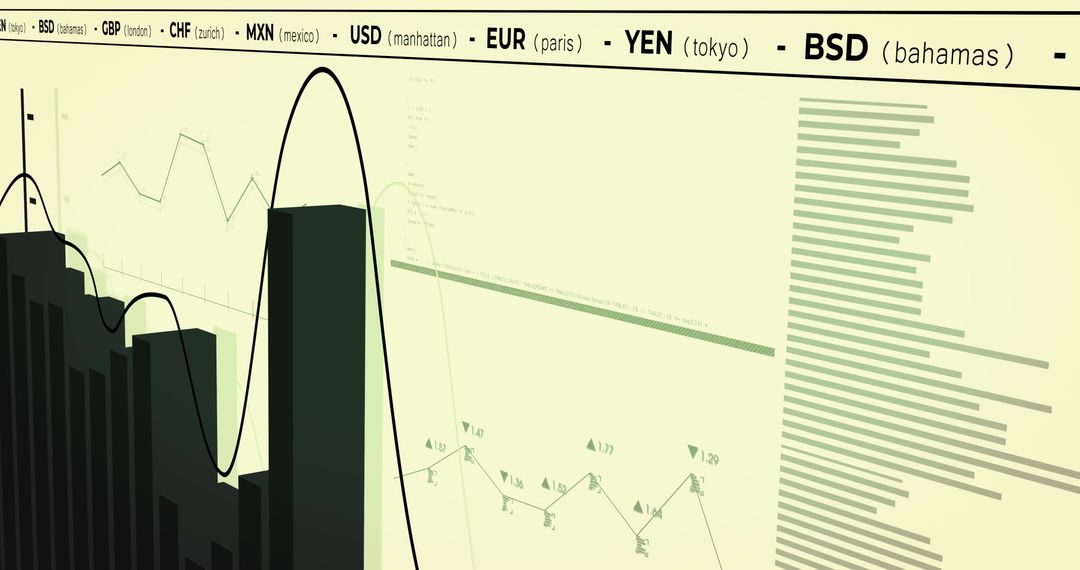
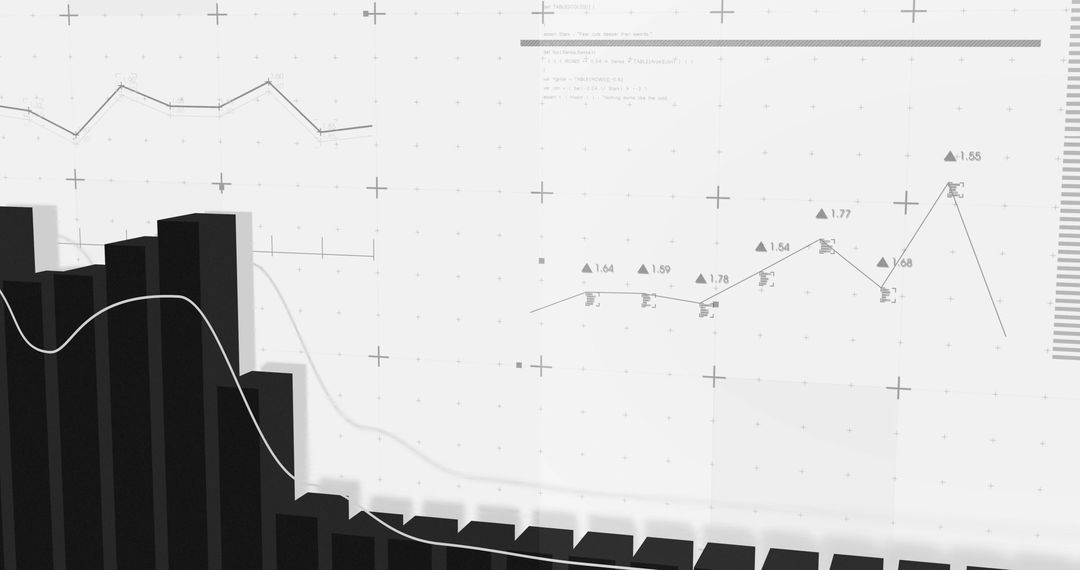
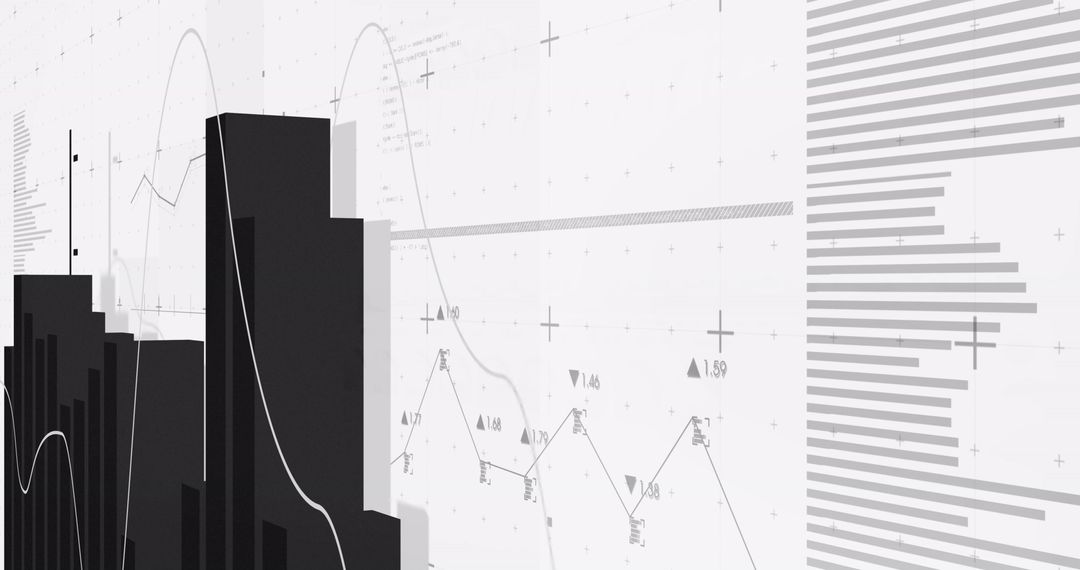
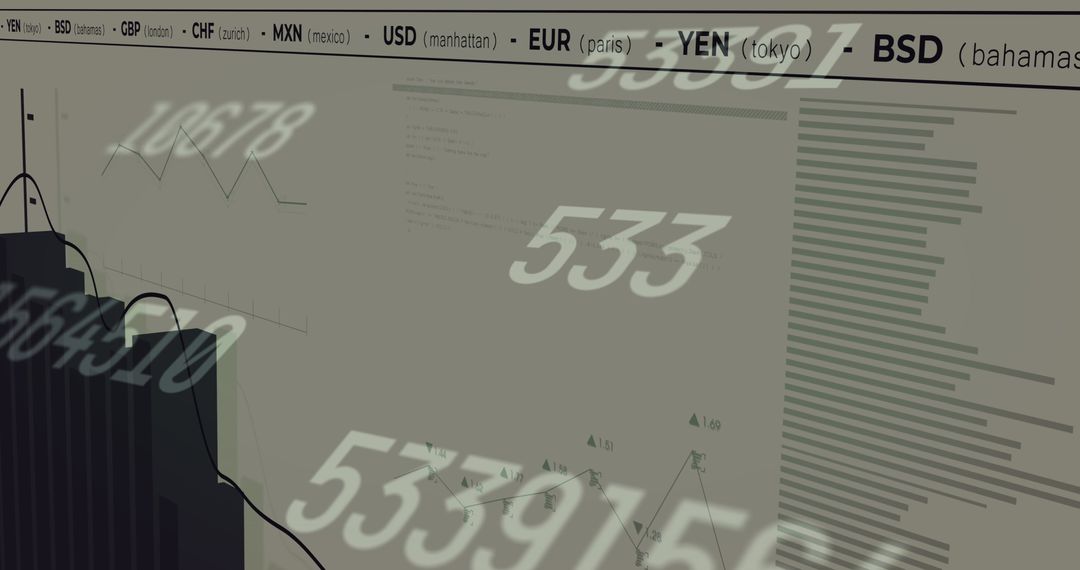
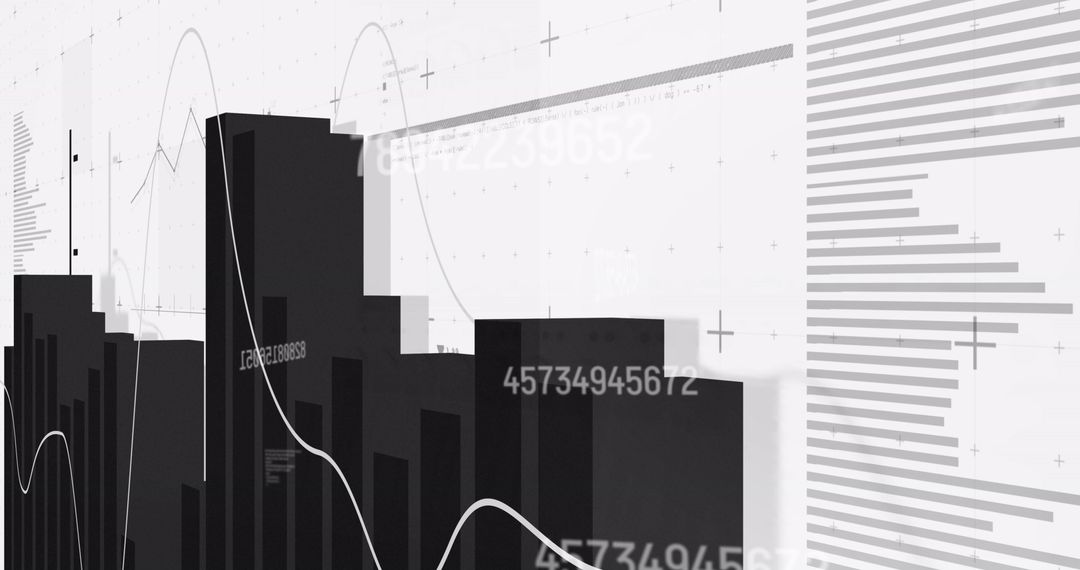
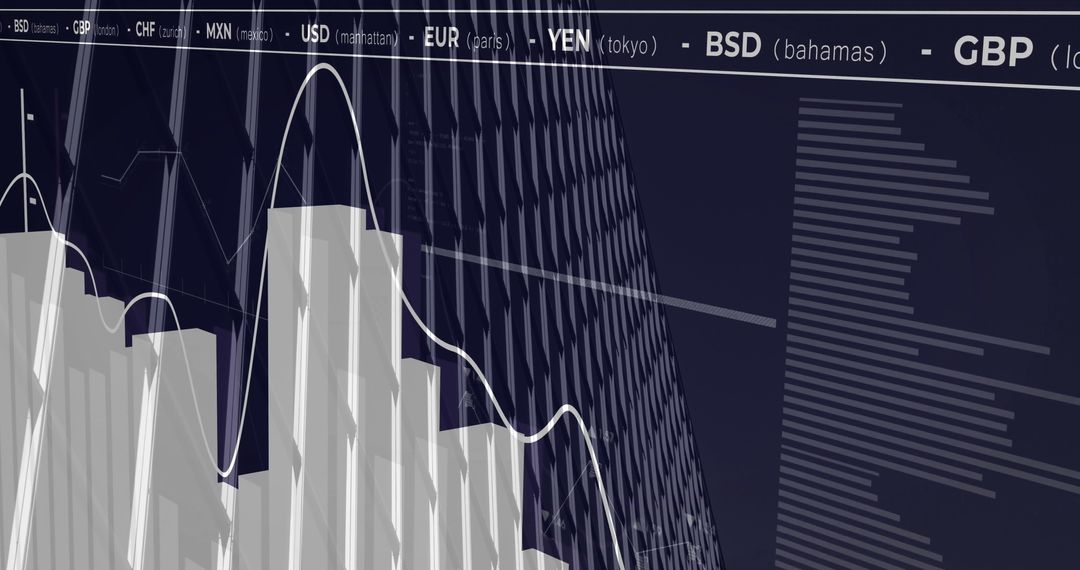
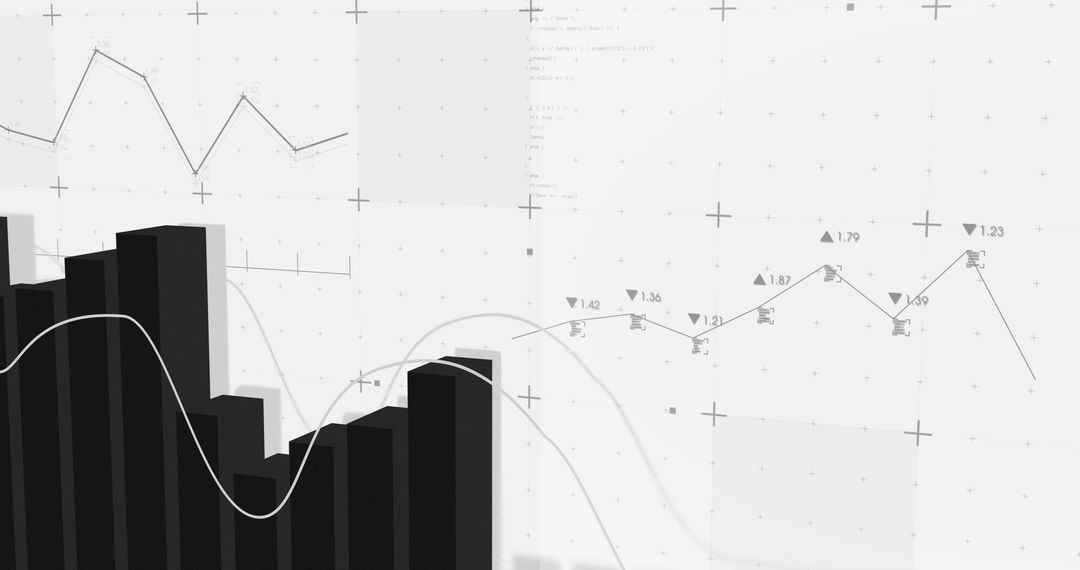
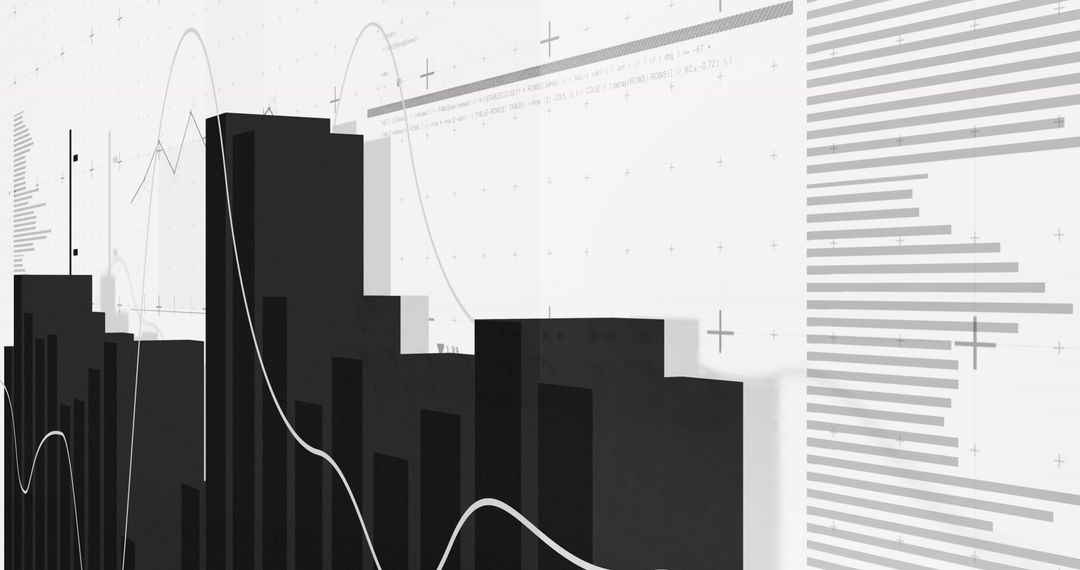
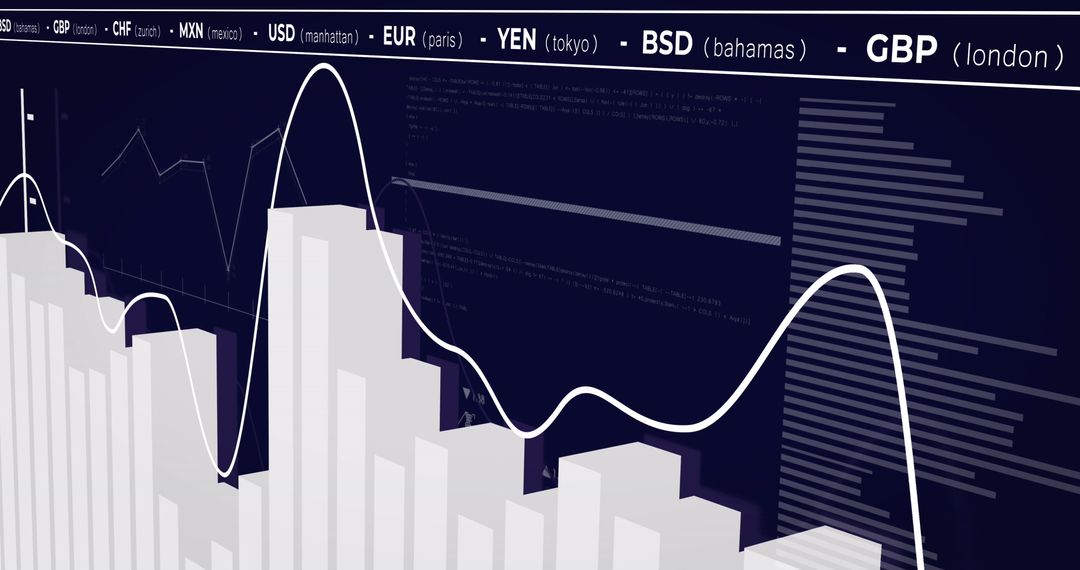
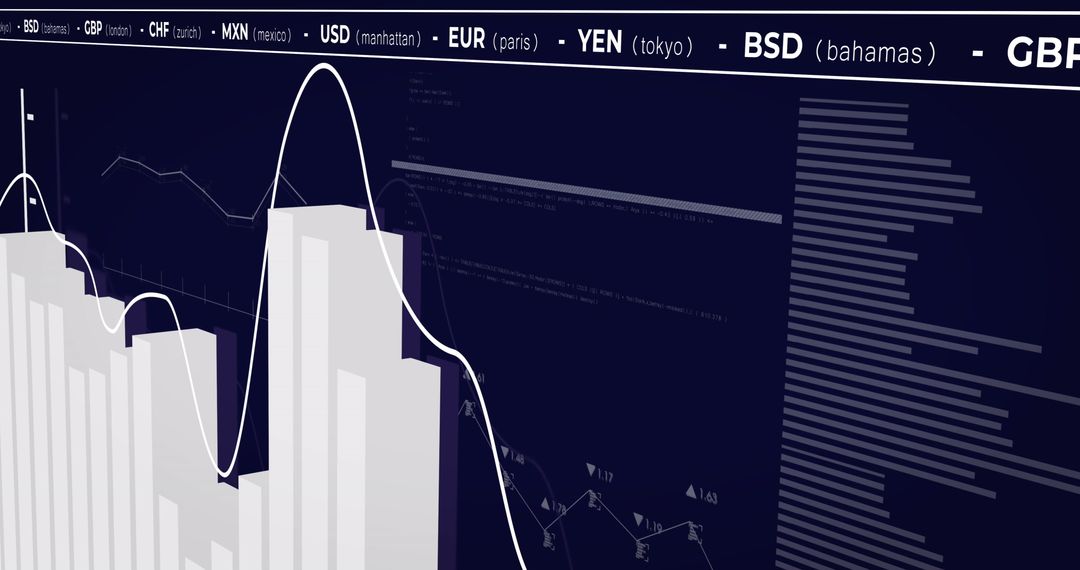
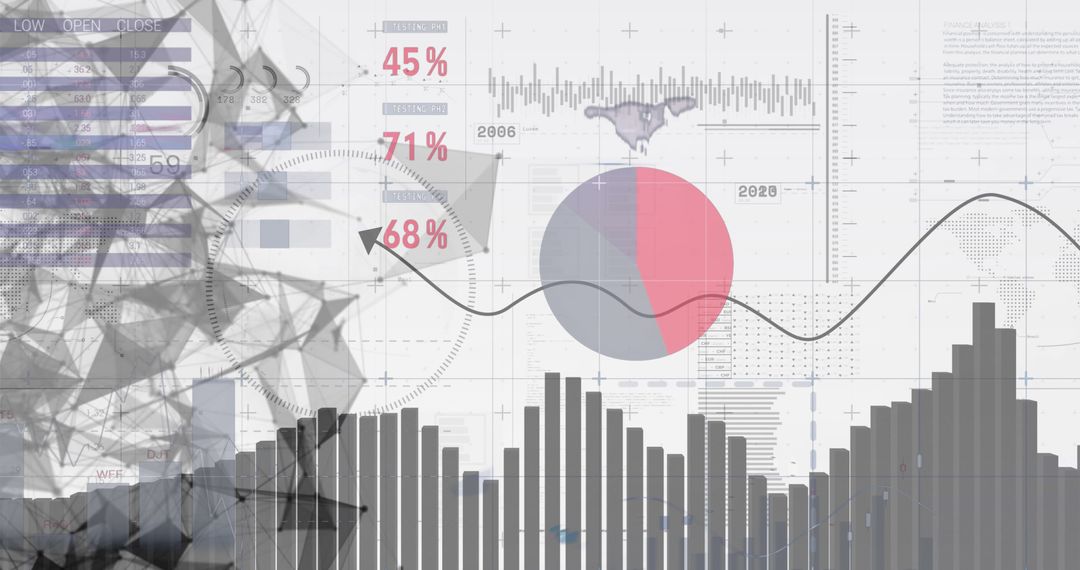
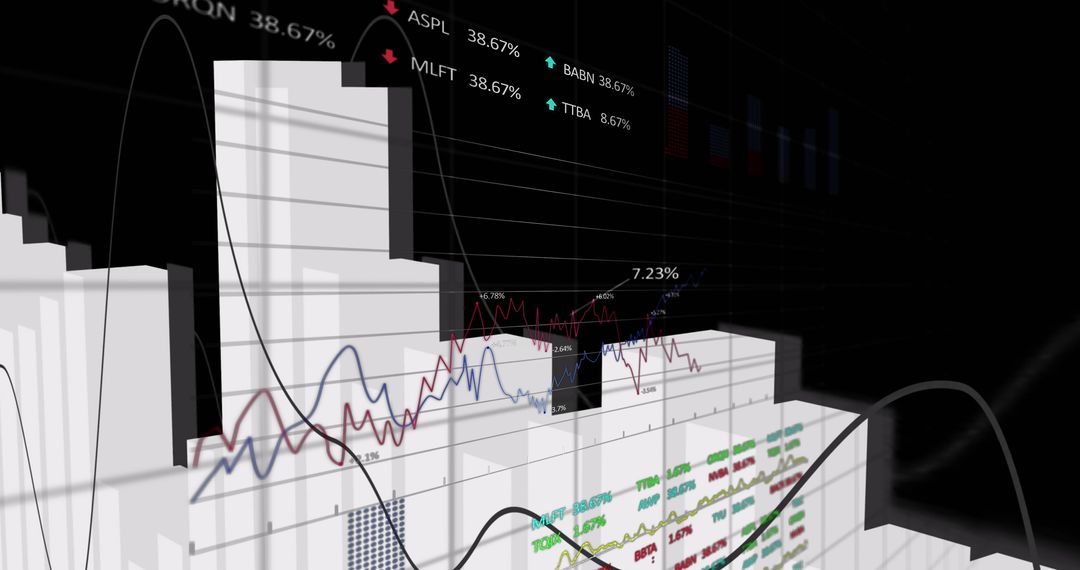
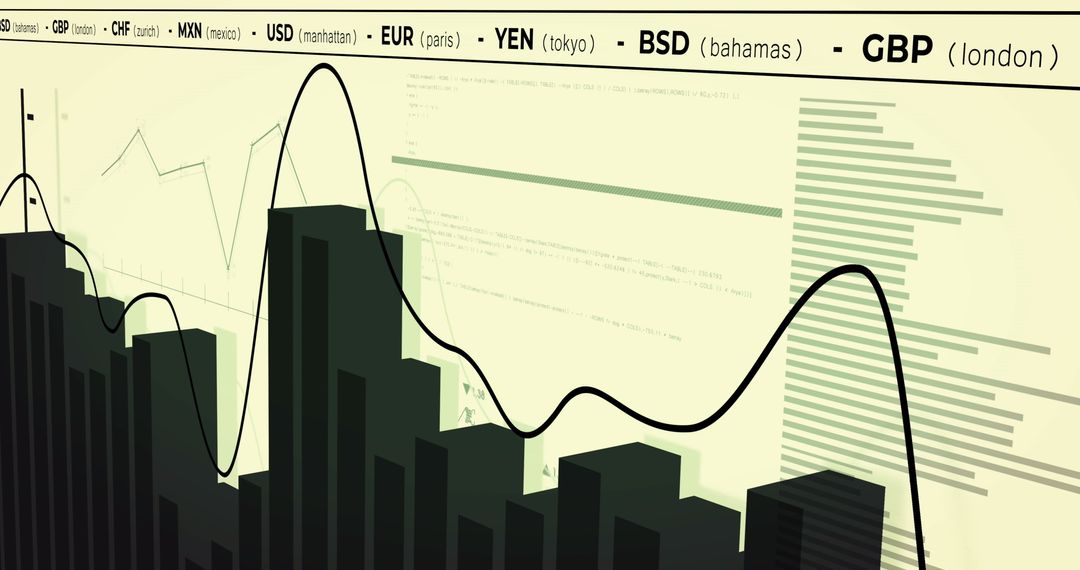
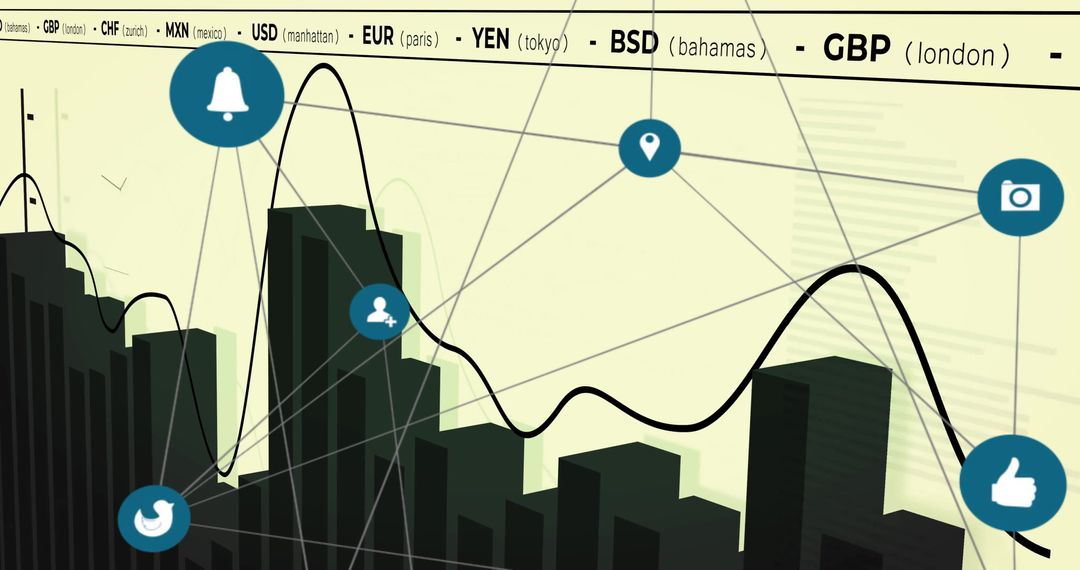
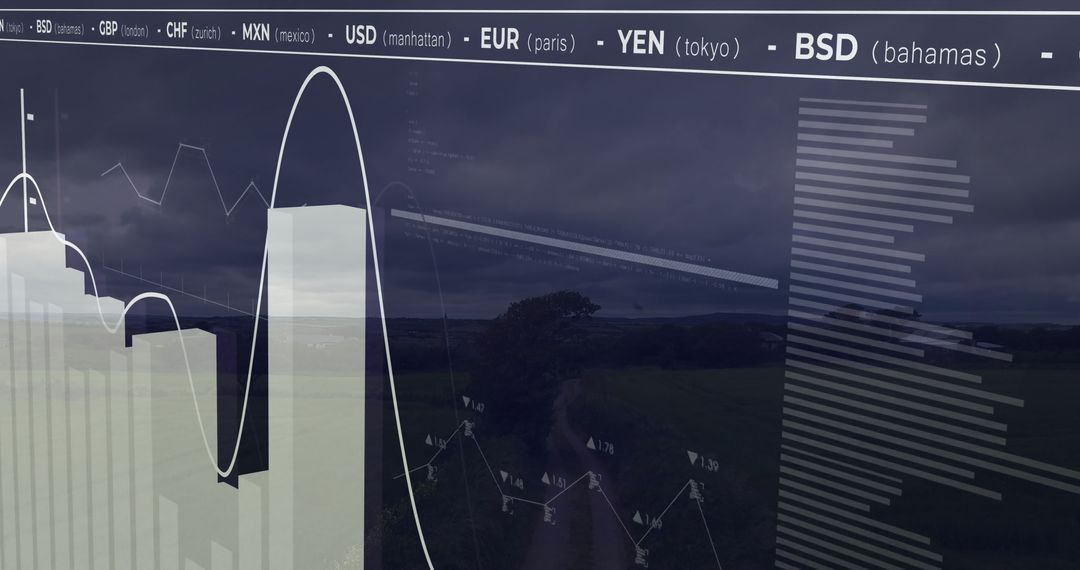
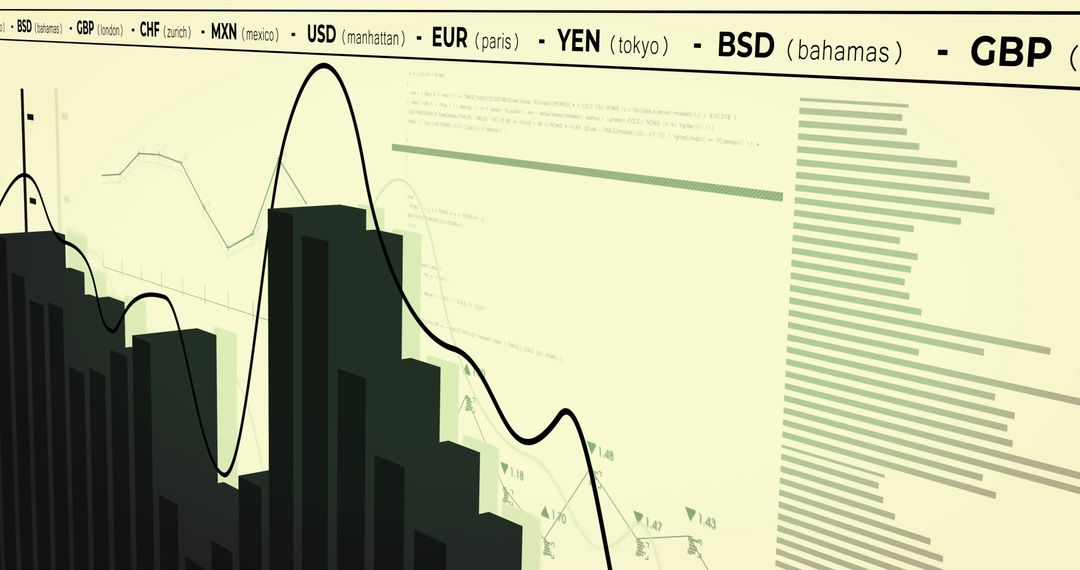
Abstract representation of financial data and currency trends on a yellow background highlights global business and financial connections, with graph lines and currency codes indicating economic indicators. Suitable for illustrating economic reports, stock market magazines, financial analyses, business presentations, and digital content on global economy.
Powered by 


2
downloads
downloads
Tags:
More
Credit Photo
If you would like to credit the Photo, here are some ways you can do so
Text Link
photo Link
<span class="text-link">
<span>
<a target="_blank" href=https://pikwizard.com/photo/abstract-financial-data-visualization-in-yellow-tones/67a12f6564e20cf98975bcc192ddd230/>PikWizard</a>
</span>
</span>
<span class="image-link">
<span
style="margin: 0 0 20px 0; display: inline-block; vertical-align: middle; width: 100%;"
>
<a
target="_blank"
href="https://pikwizard.com/photo/abstract-financial-data-visualization-in-yellow-tones/67a12f6564e20cf98975bcc192ddd230/"
style="text-decoration: none; font-size: 10px; margin: 0;"
>
<img src="https://pikwizard.com/pw/medium/67a12f6564e20cf98975bcc192ddd230.jpg" style="margin: 0; width: 100%;" alt="" />
<p style="font-size: 12px; margin: 0;">PikWizard</p>
</a>
</span>
</span>
Free (free of charge)
Free for personal and commercial use.
Author: Awesome Content
Similar Free Stock Images
Premium


Premium


Premium


Premium


Premium


Premium


Premium


Premium


Premium


Premium


Premium


Premium


Premium


Premium


Premium


Premium


Premium


Premium


Premium


Premium


Premium


Premium


Premium


Premium